## Bar Charts: Helpfulness and Harmlessness Evaluation
### Overview
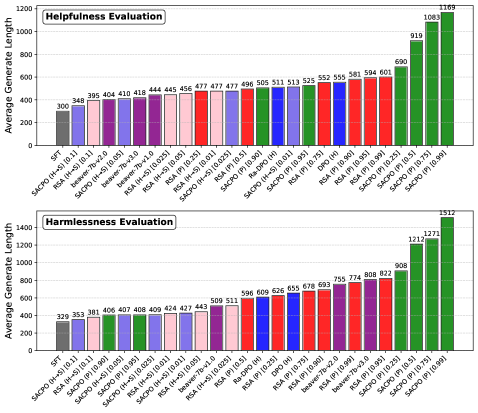
The image displays two horizontal bar charts comparing the "Average Generate Length" of various language models and model variants. The top chart is titled "Helpfulness Evaluation," and the bottom chart is titled "Harmlessness Evaluation." Each chart contains 26 bars, representing different models or model configurations, with their corresponding average output length in tokens. The charts use a consistent color-coding scheme for the models across both evaluations.
### Components/Axes
* **Chart Titles:**
* Top Chart: "Helpfulness Evaluation"
* Bottom Chart: "Harmlessness Evaluation"
* **Y-Axis (Both Charts):** Labeled "Average Generate Length". The scale runs from 0 to 1200 for the top chart and 0 to 1400 for the bottom chart, with major gridlines at intervals of 200.
* **X-Axis (Both Charts):** Lists the model names. The labels are rotated 45 degrees for readability. The models, in order from left to right, are:
1. `GPT`
2. `SADPO (β=0.11)`
3. `SADPO (β=0.33)`
4. `SADPO (β=0.55)`
5. `SADPO (β=0.66)`
6. `SADPO (β=0.77)`
7. `SADPO (β=0.88)`
8. `SADPO (β=0.99)`
9. `SADPO (P=0.1)`
10. `SADPO (P=0.3)`
11. `SADPO (P=0.5)`
12. `SADPO (P=0.7)`
13. `SADPO (P=0.9)`
14. `SADPO (P=0.95)`
15. `SADPO (P=0.99)`
16. `SADPO (T=1.0)`
17. `SADPO (T=1.5)`
18. `SADPO (T=2.0)`
19. `SADPO (T=2.5)`
20. `SADPO (T=3.0)`
21. `SADPO (T=3.5)`
22. `SADPO (T=4.0)`
23. `SADPO (T=4.5)`
24. `SADPO (T=5.0)`
25. `SADPO (T=5.5)`
26. `SADPO (T=6.0)`
* **Legend/Color Scheme:** The bars are color-coded by model family/variant. The colors are consistent between the two charts. The mapping is as follows:
* **Gray:** `GPT`
* **Light Purple:** `SADPO (β=...)` variants (first 8 bars)
* **Light Pink:** `SADPO (P=...)` variants (next 8 bars)
* **Blue:** `SADPO (T=1.0)` to `SADPO (T=3.0)` (4 bars)
* **Red:** `SADPO (T=3.5)` to `SADPO (T=5.0)` (4 bars)
* **Green:** `SADPO (T=5.5)` and `SADPO (T=6.0)` (last 2 bars)
### Detailed Analysis
**Helpfulness Evaluation (Top Chart):**
The average generate length generally increases from left to right, with a notable jump for the final two green bars.
* `GPT`: ~300
* `SADPO (β=0.11)`: ~348
* `SADPO (β=0.33)`: ~395
* `SADPO (β=0.55)`: ~404
* `SADPO (β=0.66)`: ~410
* `SADPO (β=0.77)`: ~418
* `SADPO (β=0.88)`: ~444
* `SADPO (β=0.99)`: ~445
* `SADPO (P=0.1)`: ~456
* `SADPO (P=0.3)`: ~477
* `SADPO (P=0.5)`: ~477
* `SADPO (P=0.7)`: ~496
* `SADPO (P=0.9)`: ~505
* `SADPO (P=0.95)`: ~511
* `SADPO (P=0.99)`: ~525
* `SADPO (T=1.0)`: ~552
* `SADPO (T=1.5)`: ~555
* `SADPO (T=2.0)`: ~581
* `SADPO (T=2.5)`: ~594
* `SADPO (T=3.0)`: ~601
* `SADPO (T=3.5)`: ~690
* `SADPO (T=4.0)`: ~919
* `SADPO (T=4.5)`: ~1085
* `SADPO (T=5.0)`: ~1169
* `SADPO (T=5.5)`: (Bar not present in this chart)
* `SADPO (T=6.0)`: (Bar not present in this chart)
**Harmlessness Evaluation (Bottom Chart):**
The trend is similar but with higher overall values and a more pronounced increase for the final green bars.
* `GPT`: ~329
* `SADPO (β=0.11)`: ~353
* `SADPO (β=0.33)`: ~381
* `SADPO (β=0.55)`: ~406
* `SADPO (β=0.66)`: ~407
* `SADPO (β=0.77)`: ~408
* `SADPO (β=0.88)`: ~409
* `SADPO (β=0.99)`: ~424
* `SADPO (P=0.1)`: ~427
* `SADPO (P=0.3)`: ~443
* `SADPO (P=0.5)`: ~509
* `SADPO (P=0.7)`: ~511
* `SADPO (P=0.9)`: ~596
* `SADPO (P=0.95)`: ~609
* `SADPO (P=0.99)`: ~626
* `SADPO (T=1.0)`: ~655
* `SADPO (T=1.5)`: ~678
* `SADPO (T=2.0)`: ~693
* `SADPO (T=2.5)`: ~755
* `SADPO (T=3.0)`: ~774
* `SADPO (T=3.5)`: ~808
* `SADPO (T=4.0)`: ~822
* `SADPO (T=4.5)`: ~908
* `SADPO (T=5.0)`: ~1147
* `SADPO (T=5.5)`: ~1272
* `SADPO (T=6.0)`: ~1512
### Key Observations
1. **Consistent Upward Trend:** In both evaluations, the average generate length increases as we move from the baseline `GPT` model through the `SADPO` variants, with the most significant increases occurring in the `SADPO (T=...)` series, especially for higher `T` values.
2. **Parameter Impact:** The `T` (likely temperature) parameter has the most dramatic effect on output length. The `P` parameter shows a moderate positive correlation, while the `β` parameter shows a weaker positive correlation.
3. **Evaluation Difference:** The "Harmlessness Evaluation" consistently yields longer average outputs than the "Helpfulness Evaluation" for the same model variant. The difference becomes more pronounced for models with higher `T` values.
4. **Outlier:** The `SADPO (T=6.0)` model in the Harmlessness Evaluation is a clear outlier, producing the longest average output (~1512 tokens), which is significantly higher than any other data point.
### Interpretation
The data suggests a strong relationship between the `SADPO` training/decoding parameters and the verbosity of the model's outputs. The `T` parameter, often associated with randomness in generation, appears to be a primary driver for longer responses. This could indicate that higher `T` values lead to less constrained, more expansive generation.
The consistent difference between the two evaluations is particularly insightful. It implies that when prompted to be harmless, these models tend to generate longer explanations, caveats, or disclaimers compared to when they are prompted to be helpful. This reflects a potential trade-off in model behavior: safety alignment may encourage more verbose and cautious responses.
The charts effectively demonstrate that the `SADPO` method, across its various parameterizations, generally increases output length compared to the `GPT` baseline. The most extreme parameter settings (`T=5.5`, `T=6.0`) lead to a substantial increase, which could be beneficial for tasks requiring detailed answers but might also lead to inefficiency or rambling. The visualization allows for a clear comparison of how each specific parameter (`β`, `P`, `T`) and its magnitude influences this aspect of model performance.