## Bar Chart: Percent of Incorrect Answers by Grounding Type
### Overview
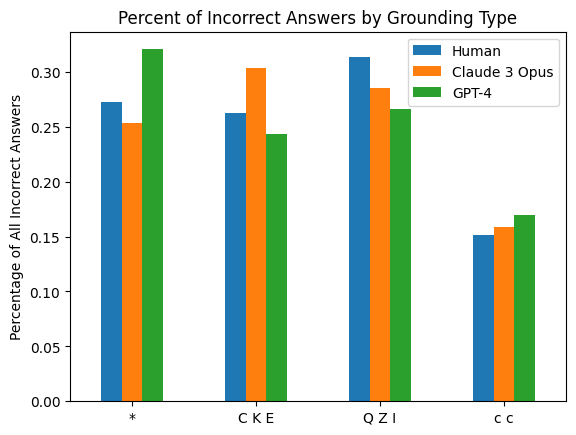
The image is a grouped bar chart comparing the percentage of incorrect answers across four different "Grounding Types" for three distinct entities: Human, Claude 3 Opus, and GPT-4. The chart visually demonstrates how the error rate varies by grounding method and by the answering entity.
### Components/Axes
* **Chart Title:** "Percent of Incorrect Answers by Grounding Type"
* **Y-Axis:**
* **Label:** "Percentage of All Incorrect Answers"
* **Scale:** Linear scale from 0.00 to 0.30, with major tick marks at 0.05 intervals (0.00, 0.05, 0.10, 0.15, 0.20, 0.25, 0.30).
* **X-Axis:**
* **Categories (Grounding Types):** Four distinct categories are labeled:
1. `*` (asterisk)
2. `C K E`
3. `Q Z I`
4. `c c`
* **Legend:** Located in the top-right corner of the plot area. It defines the three data series by color:
* **Blue:** Human
* **Orange:** Claude 3 Opus
* **Green:** GPT-4
### Detailed Analysis
The chart presents the following approximate data points for each grounding type and entity. Values are estimated based on bar height relative to the y-axis grid.
**1. Grounding Type: `*`**
* **Human (Blue):** ~0.27 (27%)
* **Claude 3 Opus (Orange):** ~0.25 (25%)
* **GPT-4 (Green):** ~0.32 (32%) - This is the highest single value on the chart.
**2. Grounding Type: `C K E`**
* **Human (Blue):** ~0.26 (26%)
* **Claude 3 Opus (Orange):** ~0.30 (30%)
* **GPT-4 (Green):** ~0.24 (24%)
**3. Grounding Type: `Q Z I`**
* **Human (Blue):** ~0.31 (31%)
* **Claude 3 Opus (Orange):** ~0.28 (28%)
* **GPT-4 (Green):** ~0.26 (26%)
**4. Grounding Type: `c c`**
* **Human (Blue):** ~0.15 (15%)
* **Claude 3 Opus (Orange):** ~0.16 (16%)
* **GPT-4 (Green):** ~0.17 (17%) - This is the lowest set of values on the chart.
### Key Observations
* **Highest Error Rate:** The single highest percentage of incorrect answers (~32%) is associated with **GPT-4** using the `*` grounding type.
* **Lowest Error Rate:** The lowest error rates (~15-17%) are consistently found in the `c c` grounding type category for all three entities.
* **Entity Performance Trends:**
* **Human:** Shows the highest error rate in the `Q Z I` category (~31%) and the lowest in `c c` (~15%).
* **Claude 3 Opus:** Peaks in the `C K E` category (~30%) and is lowest in `c c` (~16%).
* **GPT-4:** Has its highest error rate in the `*` category (~32%) and its lowest in `c c` (~17%).
* **Grounding Type Trends:**
* The `c c` grounding type yields the most accurate results (lowest incorrect percentages) for all three entities.
* The `*` and `Q Z I` grounding types are associated with higher error rates, though the specific entity that performs worst varies between them.
### Interpretation
This chart suggests that the method of "grounding" (likely referring to how an AI or human is provided with context or evidence to answer a question) has a significant impact on accuracy. The `c c` grounding type appears to be the most effective for reducing errors across the board.
The data also reveals that no single entity (Human, Claude 3 Opus, GPT-4) is universally the most accurate. Their relative performance is dependent on the grounding context:
* GPT-4 is the least accurate with the `*` grounding.
* Claude 3 Opus is the least accurate with the `C K E` grounding.
* Humans are the least accurate with the `Q Z I` grounding.
This implies that the interaction between the entity's capabilities and the specific grounding methodology is crucial. The chart does not explain what the grounding type labels (`*`, `C K E`, etc.) represent, but it clearly demonstrates that their design is a critical factor in performance outcomes. The notably low error rates for `c c` warrant further investigation into its methodology.