## Line Graphs: Cross-Entropy (CE) Performance Across Models and Tasks
### Overview
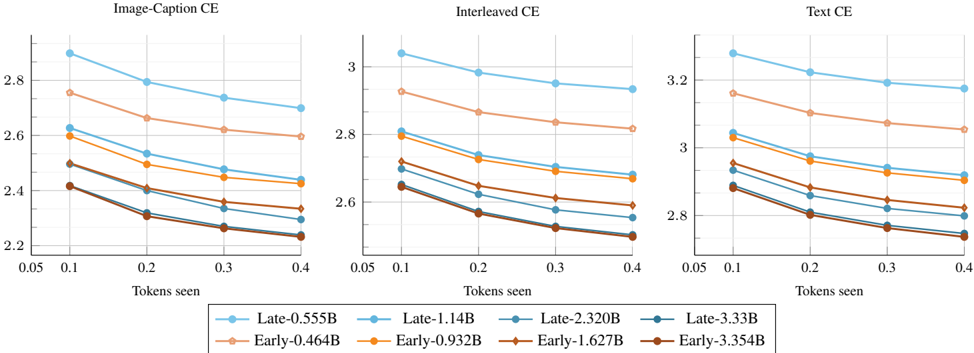
The image contains three line graphs comparing the cross-entropy (CE) performance of different machine learning models across three tasks: **Image-Caption CE**, **Interleaved CE**, and **Text CE**. Each graph plots CE values against the number of tokens seen (0.05 to 0.4), with lines representing distinct models labeled as "Late" or "Early" followed by parameter sizes (e.g., "Late-0.555B", "Early-0.464B"). The graphs show trends in CE as models process increasing amounts of data.
---
### Components/Axes
- **X-axis**: "Tokens seen" (values: 0.05, 0.1, 0.2, 0.3, 0.4)
- **Y-axis**: "CE" (values: ~2.2 to ~3.2)
- **Legends**:
- **Late models**:
- Blue: Late-0.555B
- Orange: Late-1.14B
- Brown: Late-2.320B
- Dark blue: Late-3.33B
- **Early models**:
- Peach: Early-0.464B
- Yellow: Early-0.932B
- Dark brown: Early-1.627B
- Dark blue: Early-3.354B
---
### Detailed Analysis
#### Image-Caption CE
- **Late models**:
- Late-0.555B: Starts at ~2.9 (0.05 tokens) and decreases to ~2.7 (0.4 tokens).
- Late-1.14B: Starts at ~2.8 and decreases to ~2.6.
- Late-2.320B: Starts at ~2.7 and decreases to ~2.5.
- Late-3.33B: Starts at ~2.6 and decreases to ~2.4.
- **Early models**:
- Early-0.464B: Starts at ~2.8 and decreases to ~2.6.
- Early-0.932B: Starts at ~2.7 and decreases to ~2.5.
- Early-1.627B: Starts at ~2.6 and decreases to ~2.4.
- Early-3.354B: Starts at ~2.5 and decreases to ~2.3.
#### Interleaved CE
- **Late models**:
- Late-0.555B: Starts at ~3.1 and decreases to ~2.9.
- Late-1.14B: Starts at ~3.0 and decreases to ~2.8.
- Late-2.320B: Starts at ~2.9 and decreases to ~2.7.
- Late-3.33B: Starts at ~2.8 and decreases to ~2.6.
- **Early models**:
- Early-0.464B: Starts at ~2.9 and decreases to ~2.7.
- Early-0.932B: Starts at ~2.8 and decreases to ~2.6.
- Early-1.627B: Starts at ~2.7 and decreases to ~2.5.
- Early-3.354B: Starts at ~2.6 and decreases to ~2.4.
#### Text CE
- **Late models**:
- Late-0.555B: Starts at ~3.3 and decreases to ~3.1.
- Late-1.14B: Starts at ~3.2 and decreases to ~3.0.
- Late-2.320B: Starts at ~3.1 and decreases to ~2.9.
- Late-3.33B: Starts at ~3.0 and decreases to ~2.8.
- **Early models**:
- Early-0.464B: Starts at ~3.2 and decreases to ~3.0.
- Early-0.932B: Starts at ~3.1 and decreases to ~2.9.
- Early-1.627B: Starts at ~3.0 and decreases to ~2.8.
- Early-3.354B: Starts at ~2.9 and decreases to ~2.7.
---
### Key Observations
1. **Consistent Trend**: All models show a **decreasing CE** as tokens seen increase, indicating improved performance with more data.
2. **Model Size vs. Performance**:
- Larger models (e.g., Late-3.33B, Early-3.354B) generally have **higher CE values** than smaller models, suggesting lower efficiency or higher loss.
- Early models (e.g., Early-0.464B) consistently outperform Late models of similar size (e.g., Late-0.555B) in all tasks.
3. **Task-Specific Performance**:
- **Text CE** has the highest CE values across all models, indicating greater difficulty or complexity in text tasks.
- **Image-Caption CE** has the lowest CE values, suggesting better performance in image-related tasks.
---
### Interpretation
- **Model Efficiency**: Early models (smaller parameter sizes) achieve lower CE values, implying they are more efficient or better optimized for the tasks. Late models, despite larger sizes, show higher CE, possibly due to overfitting or suboptimal training strategies.
- **Task Complexity**: The Text CE graph demonstrates the highest CE values, highlighting the inherent complexity of text-based tasks compared to image or interleaved tasks.
- **Training Strategy**: The distinction between "Late" and "Early" models suggests that training timing or methodology (e.g., early stopping, data augmentation) significantly impacts performance. Early models may benefit from more targeted training or smaller-scale optimization.
---
### Spatial Grounding
- **Legend**: Positioned at the bottom of each graph, with colors matching the lines (e.g., blue for Late-0.555B, peach for Early-0.464B).
- **Lines**: Each line is clearly differentiated by color and labeled in the legend. For example, the dark blue line in the Text CE graph corresponds to Early-3.354B.
---
### Content Details
- **Numerical Values**: All CE values are approximate, with uncertainty due to the lack of exact grid markings. For example, in the Image-Caption CE graph, the Late-3.33B line starts at ~2.6 (0.05 tokens) and ends at ~2.4 (0.4 tokens).
- **Trends**: All lines show a **negative slope**, confirming that CE decreases as tokens seen increase.
---
### Final Notes
The data underscores the trade-off between model size and performance, with smaller, early-trained models outperforming larger, later-trained ones. This could inform decisions about model selection, training strategies, and resource allocation in machine learning workflows.