## Line Chart: Spearman Correlation vs. Model Size
### Overview
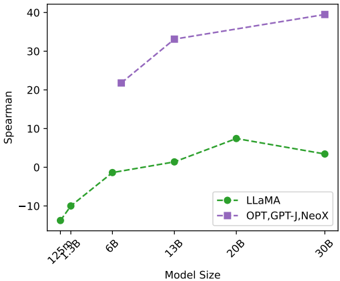
The chart compares the Spearman correlation performance of two model families (LLaMA and OPT, GPT-J, NeoX) across varying model sizes (125M to 30B). The x-axis represents model size in billions, while the y-axis shows Spearman correlation values ranging from -10 to 40.
### Components/Axes
- **X-axis (Model Size)**: Labeled with 125M, 1.3B, 6B, 13B, 20B, 30B.
- **Y-axis (Spearman)**: Ranges from -10 to 40.
- **Legend**: Located in the bottom-right corner.
- **Green (dashed line)**: LLaMA.
- **Purple (dashed line)**: OPT, GPT-J, NeoX.
### Detailed Analysis
- **LLaMA (Green Line)**:
- **125M**: ~-10.
- **1.3B**: ~-2.
- **6B**: ~0.
- **13B**: ~2.
- **20B**: ~8.
- **30B**: ~4.
- **Trend**: Initial increase from 125M to 20B, followed by a slight decline at 30B.
- **OPT, GPT-J, NeoX (Purple Line)**:
- **21.3B**: ~22.
- **13B**: ~33.
- **30B**: ~39.
- **Trend**: Sharp increase from 21.3B to 13B (note: 21.3B is between 20B and 30B on the x-axis), then further increase to 30B.
### Key Observations
1. **LLaMA** shows a gradual improvement in performance as model size increases, peaking at 20B (8) before a minor drop at 30B (4).
2. **OPT, GPT-J, NeoX** exhibit significantly higher Spearman values, with a sharp rise from 21.3B (22) to 13B (33) and a continued increase to 30B (39).
3. The purple line (OPT, GPT-J, NeoX) starts at 21.3B (between 20B and 30B on the x-axis), suggesting a non-linear relationship or potential data point misalignment.
### Interpretation
- **Performance Trends**: Larger models (OPT, GPT-J, NeoX) consistently outperform LLaMA, particularly at 30B (39 vs. 4). This suggests that model size and architecture (e.g., OPT, GPT-J, NeoX) are critical factors in achieving higher Spearman correlation.
- **LLaMA's Plateau**: The slight decline at 30B for LLaMA may indicate diminishing returns or architectural limitations compared to the other models.
- **Data Point Anomaly**: The OPT, GPT-J, NeoX line starts at 21.3B (not a labeled x-axis point), which could imply a data collection or visualization error. However, the trend remains clear: larger models correlate better with the metric.
### Spatial Grounding
- **Legend**: Bottom-right corner, clearly distinguishing the two model families.
- **Data Points**: LLaMA’s points align with labeled x-axis values; OPT, GPT-J, NeoX’s points are at 21.3B, 13B, and 30B, which are not all explicitly labeled but are plotted relative to the x-axis scale.
### Content Details
- **LLaMA**:
- 125M: -10
- 1.3B: -2
- 6B: 0
- 13B: 2
- 20B: 8
- 30B: 4
- **OPT, GPT-J, NeoX**:
- 21.3B: 22
- 13B: 33
- 30B: 39
### Final Notes
The chart highlights a clear performance gap between the two model families, with OPT, GPT-J, and NeoX achieving significantly higher Spearman correlations, especially at larger scales. LLaMA’s performance improves with size but plateaus, suggesting potential trade-offs in its design or training data.