\n
## Diagram: FairPFN Pre-training Pipeline
### Overview
This diagram illustrates the pre-training pipeline for FairPFN, a model designed for real-world inference with a focus on fairness. The pipeline consists of three main stages: data generation, transformer input, fair prediction, and then a visual representation of the process using a Structural Causal Model (SCM), an Observational Dataset, the FairPFN model itself, and the calculation of a pre-training loss.
### Components/Axes
The diagram is segmented into four main sections:
1. **Data Generation (a):** Describes the process of creating the dataset.
2. **Transformer Input (b):** Explains how the observational dataset is used as input to a transformer model.
3. **Fair Prediction (c):** Details the prediction process and loss calculation.
4. **Real-world Inference:** A visual representation of the pipeline with the SCM, Observational Dataset, FairPFN, and Pre-training Loss.
The key elements within the "Real-world Inference" section are:
* **Structural Causal Model (SCM):** Nodes labeled A₀, U₂, X₁, X₂, X₃, Yb, and Yf, with directed edges representing causal relationships.
* **Observational Dataset:** A table with columns A, X₁, X₂, X₃, and Yb.
* **FairPFN:** A complex network of interconnected nodes.
* **Pre-training Loss:** Represented by the symbols Ŷf and Yf.
### Detailed Analysis or Content Details
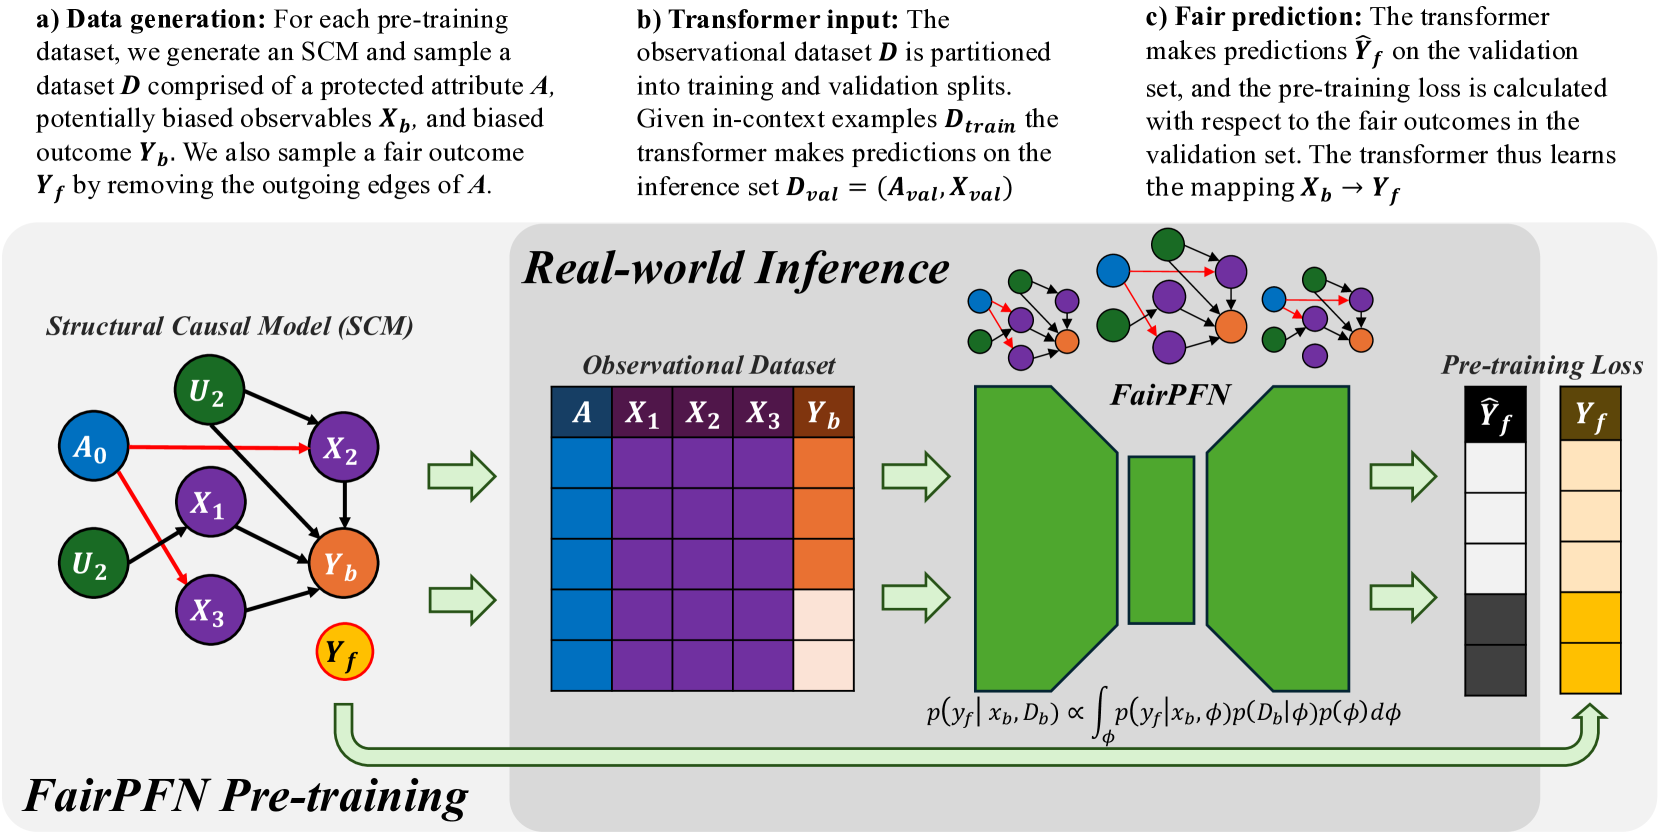
**a) Data Generation:**
* A dataset is generated comprising a protected attribute *A*, potentially biased observables *Xb*, and biased outcome *Yb*.
* A fair outcome *Yf* is sampled by removing the outgoing edges of *A*.
**b) Transformer Input:**
* The observational dataset *D* is partitioned into training and validation splits.
* Given in-context examples *Dtrain*, the transformer makes predictions on the inference set *Dval* = (*Aval*, *Xval*).
**c) Fair Prediction:**
* The transformer makes predictions Ŷf on the validation set.
* The pre-training loss is calculated with respect to the fair outcomes in the validation set.
* The transformer learns the mapping *Xb* → *Yf*.
**Real-world Inference - SCM:**
* The SCM shows causal relationships:
* U₂ influences X₁, X₂, and X₃.
* A₀ influences X₁.
* X₁, X₂, and X₃ influence Yb.
* Yb influences Yf.
**Real-world Inference - Observational Dataset:**
* The dataset table has 5 columns: A, X₁, X₂, X₃, and Yb.
* The table is filled with a heatmap-like color gradient. The colors range from dark blue to dark red, indicating varying values. It's difficult to extract precise numerical values from the color gradient without a legend, but the color intensity suggests a range of values.
* The table appears to have approximately 10-15 rows.
**Real-world Inference - FairPFN:**
* The FairPFN is a complex network of interconnected nodes. The nodes are colored in shades of green and purple.
* The network has multiple layers and connections.
**Real-world Inference - Pre-training Loss:**
* Ŷf (predicted fair outcome) is connected to Yf (fair outcome).
* The arrow indicates the calculation of the pre-training loss.
**Mathematical Formula:**
* p(*Yf* | *Xb*, *Db*) ∝ ∫ p(*Yf* | *Xb*, φ)p(*D♭* | φ) dφ
### Key Observations
* The diagram emphasizes the importance of fairness by explicitly generating a "fair outcome" (*Yf*) and using it for loss calculation.
* The SCM visually represents the causal relationships between variables, highlighting the potential for bias introduced by the protected attribute *A*.
* The heatmap-like representation of the observational dataset suggests that the data is high-dimensional and potentially complex.
* The FairPFN model is a complex neural network, likely designed to capture intricate relationships in the data.
### Interpretation
The diagram illustrates a pipeline for training a fair machine learning model. The core idea is to mitigate bias by explicitly modeling the causal relationships between variables and using a "fair outcome" as the target for training. The SCM provides a visual representation of these relationships, while the observational dataset provides the data for training. The FairPFN model learns to predict the fair outcome, and the pre-training loss ensures that the model is aligned with the desired fairness criteria. The mathematical formula suggests a probabilistic approach to fairness, where the model aims to estimate the probability of the fair outcome given the observed data. The use of a transformer model suggests that the pipeline is designed to handle sequential or contextual data. The diagram suggests a sophisticated approach to fairness that goes beyond simply removing the protected attribute from the training data. It attempts to address the underlying causal mechanisms that lead to bias.