## Line Graph: Performance Comparison of Learning-Agent and Standard-Agent
### Overview
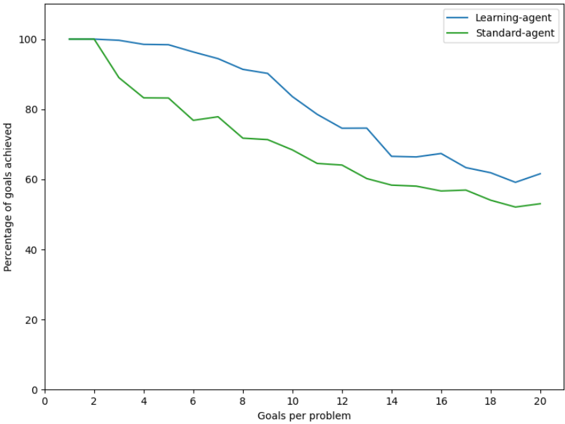
The image depicts a line graph comparing the performance of two agents—**Learning-agent** (blue line) and **Standard-agent** (green line)—across varying numbers of goals per problem. The y-axis represents the percentage of goals achieved (0–100%), while the x-axis represents the number of goals per problem (0–20). Both lines show a downward trend, but the Learning-agent consistently outperforms the Standard-agent.
---
### Components/Axes
- **X-axis (Horizontal)**: "Goals per problem" (0–20, increments of 2).
- **Y-axis (Vertical)**: "Percentage of goals achieved" (0–100, increments of 20).
- **Legend**: Located in the top-right corner.
- **Blue line**: Learning-agent.
- **Green line**: Standard-agent.
---
### Detailed Analysis
1. **Learning-agent (Blue Line)**:
- Starts at **100%** for 0–2 goals per problem.
- Declines gradually: ~98% at 4 goals, ~95% at 6 goals, ~90% at 8 goals, ~85% at 10 goals, ~75% at 12 goals, ~70% at 14 goals, ~68% at 16 goals, ~62% at 18 goals, and ~60% at 20 goals.
- Maintains a relatively stable slope with minor fluctuations.
2. **Standard-agent (Green Line)**:
- Starts at **100%** for 0–2 goals per problem.
- Drops sharply: ~85% at 4 goals, ~78% at 6 goals, ~70% at 8 goals, ~65% at 10 goals, ~60% at 12 goals, ~58% at 14 goals, ~56% at 16 goals, ~52% at 18 goals, and ~50% at 20 goals.
- Exhibits a steeper and more erratic decline compared to the Learning-agent.
---
### Key Observations
- Both agents achieve **100% goal completion** for 0–2 goals per problem.
- The performance gap between the agents narrows as the number of goals increases (e.g., ~15% difference at 20 goals vs. ~30% at 4 goals).
- The Learning-agent’s decline is smoother, while the Standard-agent’s performance deteriorates more abruptly.
---
### Interpretation
The data suggests that the **Learning-agent** is more adaptable to increasing problem complexity (higher goals per problem), maintaining higher efficiency even as performance declines. The Standard-agent’s steeper drop indicates it struggles with scalability, likely due to a lack of adaptive mechanisms. The narrowing gap at higher goal counts implies that while the Learning-agent’s advantage persists, the relative performance difference diminishes as problem difficulty rises. This could reflect the Learning-agent’s ability to optimize strategies dynamically, whereas the Standard-agent relies on static, less flexible approaches.
No textual content or additional data tables are present in the image. All values are approximate, derived from visual estimation of the graph’s trends.