## Line Graph: Information Gain vs R² Values Over Training Steps
### Overview
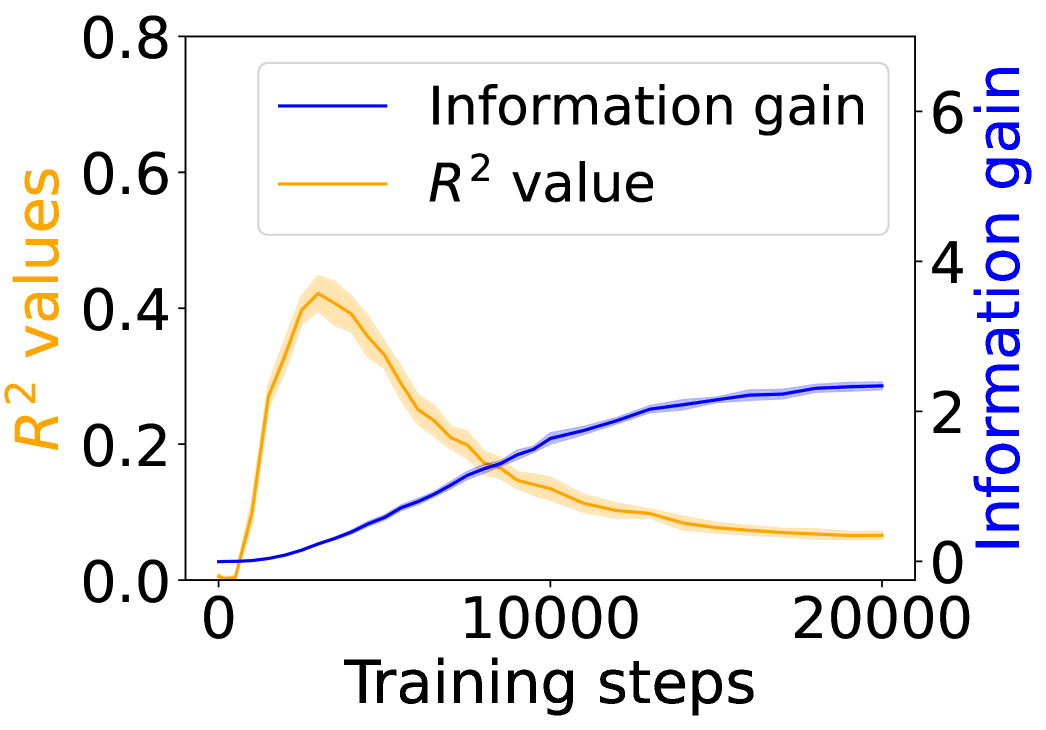
The image depicts a line graph comparing two metrics—**Information gain** (blue line) and **R² value** (orange line)—across **20,000 training steps**. The graph includes a secondary y-axis for Information gain (right side) and a primary y-axis for R² values (left side). Both lines exhibit distinct trends, with the R² value peaking early and declining, while Information gain rises steadily after an initial dip.
---
### Components/Axes
- **X-axis**: "Training steps" (0 to 20,000, linear scale).
- **Left Y-axis**: "R² values" (0 to 0.8, linear scale).
- **Right Y-axis**: "Information gain" (0 to 6, linear scale).
- **Legend**: Located in the top-left corner, with:
- **Blue line**: "Information gain"
- **Orange line**: "R² value"
---
### Detailed Analysis
1. **R² Value (Orange Line)**:
- Starts near 0 at 0 training steps.
- Peaks sharply at ~5,000 steps (~0.45 R² value).
- Declines steadily to ~0.05 by 20,000 steps.
- Shaded orange region indicates uncertainty (standard error), narrowing as training progresses.
2. **Information Gain (Blue Line)**:
- Begins near 0 at 0 steps.
- Dips slightly below 1,000 steps.
- Rises steadily to ~2.5 by 20,000 steps.
- Shaded blue region shows increasing uncertainty over time.
3. **Inverse Relationship**:
- The R² value and Information gain exhibit an inverse correlation: as R² peaks early, Information gain remains low, then diverges as R² declines while Information gain increases.
---
### Key Observations
- **Early Overperformance**: R² value peaks at ~5,000 steps (~0.45), suggesting initial model improvement.
- **Divergence Post-5,000 Steps**: After the R² peak, Information gain becomes the dominant metric, rising to ~2.5 by 20,000 steps.
- **Uncertainty Trends**: Both metrics show increasing uncertainty (wider shaded regions) as training progresses, particularly for Information gain.
---
### Interpretation
The graph suggests a trade-off between model performance metrics during training:
- **Early Training**: High R² values indicate strong initial correlations, but Information gain remains low, possibly due to limited data exploration.
- **Later Training**: Declining R² values may signal overfitting or diminishing returns in predictive accuracy, while rising Information gain implies improved model efficiency or feature relevance.
- **Practical Implications**: The divergence highlights the importance of balancing accuracy (R²) with efficiency (Information gain) in model selection, especially in resource-constrained scenarios.
The inverse relationship raises questions about whether the model prioritizes accuracy early on but shifts toward efficiency as training matures, or if the metrics reflect competing objectives (e.g., memorization vs. generalization).