\n
## Diagram: Finite State Automaton (FSA) Illustration
### Overview
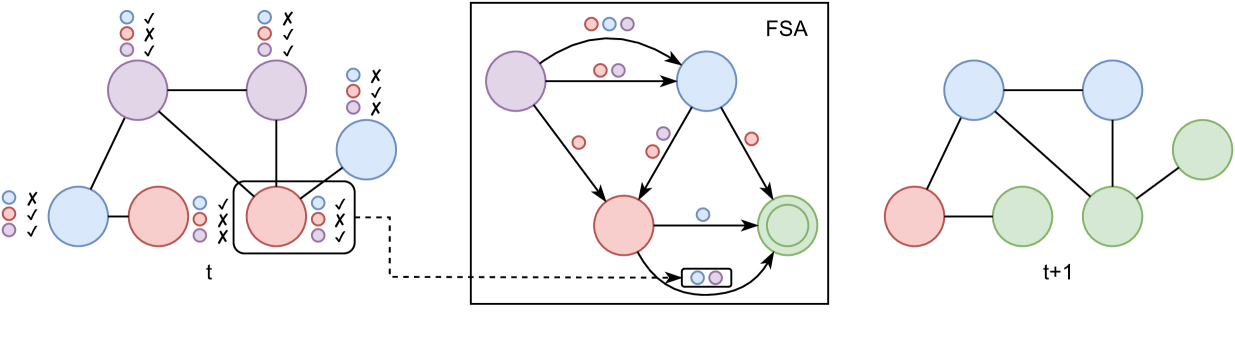
The image depicts a diagram illustrating a Finite State Automaton (FSA) and its state transitions over time. It shows three stages: a state at time 't', the FSA transition process, and the resulting state at time 't+1'. The diagram uses colored circles to represent states and arrows to represent transitions. Each state is annotated with a set of symbols ('O', 'X', '✓').
### Components/Axes
The diagram consists of three main sections:
1. **Left:** Initial state at time 't'. Contains three states (purple, light blue, and light blue) each with a set of symbols.
2. **Center:** The FSA transition diagram, labeled "FSA". This section shows the connections between states and the symbols that trigger transitions.
3. **Right:** Resulting state at time 't+1'. Contains three states (light blue, light blue, and green) each with a set of symbols.
The symbols used within the states are 'O', 'X', and '✓'. The FSA diagram itself contains states represented by circles in purple, red, light blue, and green. Arrows indicate transitions between these states. A rectangular box with "OO" inside is also present.
### Detailed Analysis / Content Details
**Time t (Left):**
* **Purple State:** Contains approximately 6 symbols: 2 'O', 3 'X', and 1 '✓'.
* **Light Blue State (Top):** Contains approximately 6 symbols: 2 'O', 3 'X', and 1 '✓'.
* **Light Blue State (Bottom):** Contains approximately 6 symbols: 3 'O', 2 'X', and 1 '✓'.
**FSA Transition (Center):**
* **Purple State (Top-Left):** Has two outgoing arrows, one to a red state and one to a light blue state. Each arrow is associated with two 'O' symbols.
* **Red State (Top-Center):** Has two outgoing arrows, both to light blue states. Each arrow is associated with one 'O' symbol.
* **Light Blue State (Top-Right):** Has one outgoing arrow to a red state, associated with one 'O' symbol.
* **Purple State (Bottom-Left):** Has one outgoing arrow to a red state, associated with one 'O' symbol.
* **Red State (Bottom-Center):** Has two outgoing arrows: one to a light blue state and one to a green state. The arrow to the light blue state is associated with one 'O' symbol. The arrow to the green state is associated with two 'O' symbols and is contained within a dashed box.
* **Light Blue State (Bottom-Right):** Has one outgoing arrow to a green state, associated with one 'O' symbol.
* **Rectangular Box:** Contains "OO" and is connected to the red state.
**Time t+1 (Right):**
* **Light Blue State (Top):** Contains approximately 6 symbols: 2 'O', 3 'X', and 1 '✓'.
* **Light Blue State (Bottom):** Contains approximately 6 symbols: 2 'O', 3 'X', and 1 '✓'.
* **Green State:** Contains approximately 6 symbols: 3 'O', 2 'X', and 1 '✓'.
### Key Observations
* The symbols 'O', 'X', and '✓' appear to represent input or state characteristics.
* The FSA transitions are triggered by the 'O' symbol.
* The number of symbols within each state remains relatively constant across time steps.
* The diagram illustrates a deterministic FSA, as each state has a defined transition for each input symbol.
### Interpretation
The diagram demonstrates the operation of a Finite State Automaton. The FSA takes input (represented by 'O') and transitions between states based on this input. The symbols 'X' and '✓' likely represent internal state information or conditions. The diagram shows how the FSA evolves from an initial state at time 't' to a new state at time 't+1' through a series of transitions. The dashed box around the transition to the green state suggests a special or significant transition. The FSA is a mathematical model of computation used to design and analyze systems with a finite number of states and transitions. The diagram provides a visual representation of this concept, illustrating how the FSA processes input and changes its state accordingly. The consistent number of symbols within each state suggests that the FSA is not accumulating or losing information during the transitions; it is simply rearranging its internal state.