## Diagram: Machine Learning & Physics for Materials Discovery
### Overview
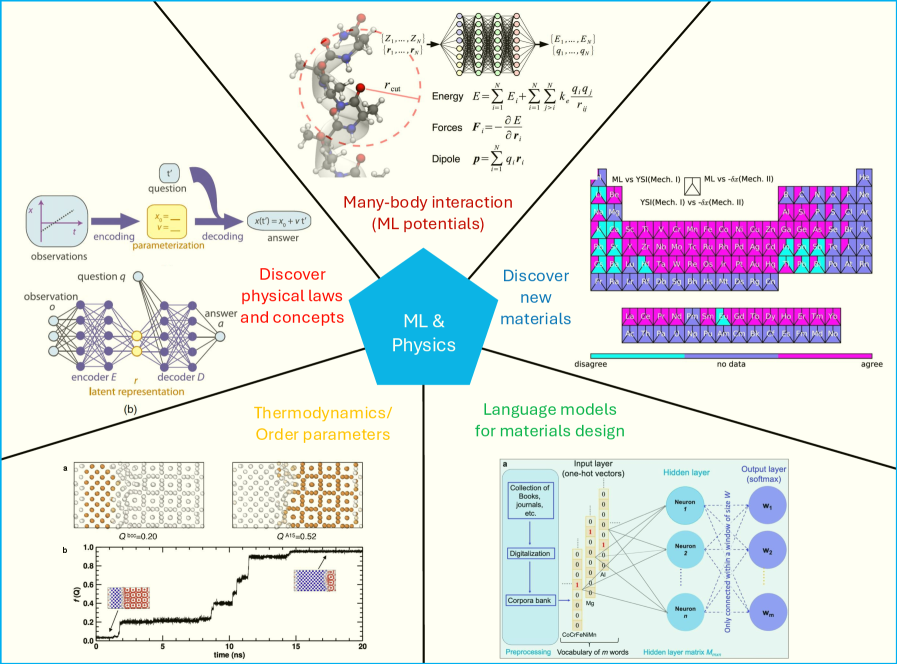
This diagram illustrates the intersection of Machine Learning (ML) and Physics, specifically focusing on materials discovery. It presents several interconnected concepts, including many-body interactions, thermodynamics, language models, and a machine learning workflow for discovering physical laws. The diagram is divided into four main sections, visually separated by angled lines.
### Components/Axes
The diagram contains the following key components:
* **Top-Right:** A periodic table-like grid with color coding indicating agreement/disagreement between ML vs. YSI(Mech. I) and ML vs. dxt(Mech. II).
* **Top-Left:** A depiction of molecular interactions with equations for Energy (E), Forces (F), and Dipole (p).
* **Bottom-Left:** A graph of correlation function r(t) vs. time (t), alongside visualizations of atomic arrangements.
* **Bottom-Right:** A neural network diagram illustrating language models for materials design.
* **Central Area:** Overlapping circles labeled "ML & Physics", "Discover physical laws and concepts", "Discover new materials".
* **Machine Learning Workflow (Left):** A diagram showing encoding, parameterization, and decoding processes.
### Detailed Analysis or Content Details
**1. Molecular Interactions (Top-Left):**
* Equations:
* Energy: E = Σᵢ Eᵢ + Σᵢ<ⱼ qᵢqⱼ/rᵢⱼ
* Forces: F = -∂E/∂r
* Dipole: p = qᵢrᵢ
* Visual: Depiction of atoms and bonds in a molecular structure.
**2. Periodic Table Grid (Top-Right):**
* The grid resembles a periodic table, but with elements colored based on the agreement between ML predictions and two mechanical models: YSI(Mech. I) and dxt(Mech. II).
* Color Coding:
* Green: Agree
* Red: Disagree
* Gray: No data
* Elements present (partial list): Y, Zr, Nb, Mo, Tc, Ru, Rh, Pd, Ag, Cd, In, Sn, Sb, Te, I, La, Ce, Pr, Nd, Sm, Eu, Gd, Tb, Dy, Er, Tm, Yb.
**3. Thermodynamics/Order Parameters (Bottom-Left):**
* Graph: Correlation function r(t) plotted against time (t).
* X-axis: Time (t) from approximately 0 to 20.
* Y-axis: Correlation function r(t) from approximately 0 to 0.8.
* The graph shows multiple curves, with a general decay in correlation over time.
* Annotations:
* "O<sup>111</sup>=0.20" at t ≈ 2
* "O<sup>111</sup>=0.52" at t ≈ 15
* Visualizations: Two atomic arrangements, one more ordered than the other.
**4. Language Models for Materials Design (Bottom-Right):**
* Neural Network Diagram:
* Input Layer: "Input layer (one-hot vectors)"
* Hidden Layer: "Hidden layer" with multiple neurons.
* Output Layer: "Output layer (softmax)"
* Components: "Digitalization", "Corpora bank", "Preprocessing", "Vocabulary of m words", "Hidden layer matrix M<sub>lstm</sub>".
* Connections: Arrows indicating the flow of information through the network.
**5. Machine Learning Workflow (Left):**
* Encoding: "observations" -> "encoding"
* Parameterization: "question q" -> "parameterization" -> "x(t) = x<sub>0</sub> + vt"
* Decoding: "latent representation" -> "decoding" -> "answer"
* Diagram: Shows a loop from observations to answer, representing the ML process.
**6. Central Overlapping Circles:**
* "ML & Physics"
* "Discover physical laws and concepts"
* "Discover new materials"
### Key Observations
* The diagram highlights the potential of ML to accelerate materials discovery by bridging the gap between physics-based simulations and data-driven approaches.
* The periodic table grid suggests varying degrees of agreement between ML predictions and established mechanical models.
* The correlation function graph indicates the decay of order over time, a common phenomenon in thermodynamic systems.
* The neural network diagram illustrates how language models can be used to represent and analyze materials data.
* The ML workflow emphasizes the iterative process of learning from observations and generating new insights.
### Interpretation
The diagram presents a holistic view of how ML can be integrated with physics to advance materials science. The central theme is the use of ML to "discover physical laws and concepts" and ultimately "discover new materials." The diagram suggests that ML can complement traditional physics-based methods by providing a data-driven approach to materials design and prediction. The periodic table grid is particularly insightful, as it visually demonstrates the areas where ML predictions align with or diverge from established theories. The inclusion of language models suggests a move towards using natural language processing to extract knowledge from the vast amount of materials literature. The diagram implies that a combination of physics-based modeling, data analysis, and machine learning is crucial for accelerating the pace of materials innovation. The correlation function graph and the molecular interaction equations provide a grounding in the underlying physics, while the ML components offer a pathway to explore complex materials systems more efficiently.