\n
## Diagram: Merged Dependencies
### Overview
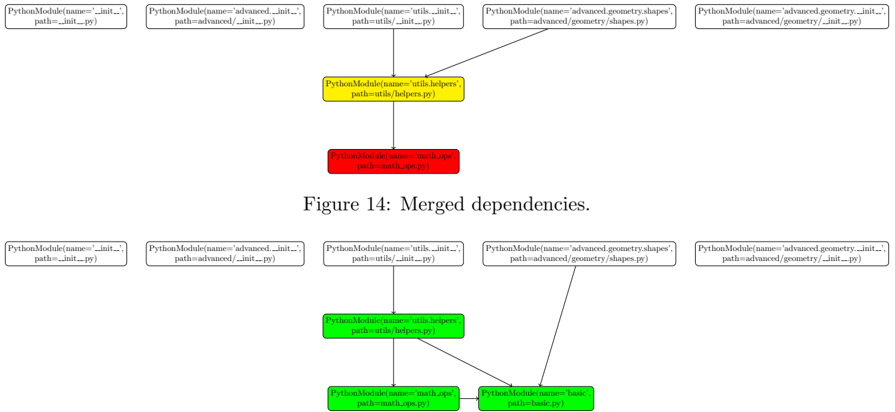
The image presents a dependency diagram illustrating the relationships between Python modules. It shows two sets of modules and their dependencies, with a central module (`utils/helpers.py`) acting as a merging point. The diagram is labeled "Figure 14: Merged dependencies."
### Components/Axes
The diagram consists of rectangular nodes representing Python modules. Each node displays the module's name and path. Arrows indicate dependencies, pointing from a dependent module to the module it depends on. The diagram is split into two sections, an upper section and a lower section, with the upper section showing dependencies before merging and the lower section showing dependencies after merging.
### Detailed Analysis or Content Details
**Upper Section:**
* Five modules are displayed horizontally:
* `PythonModule(name=__init__, path=__init__.py)` (light green)
* `PythonModule(name=advanced, path=advanced/__init__.py)` (light green)
* `PythonModule(name=utils, path=utils/__init__.py)` (light green)
* `PythonModule(name=advanced.geometry.shapes, path=advanced/geometry/shapes.py)` (light green)
* `PythonModule(name=advanced.geometry.__init__, path=advanced/geometry/__init__.py)` (light green)
* A central module `PythonModule(name=utils/helpers, path=utils/helpers.py)` (yellow) is connected to all five modules with arrows indicating dependencies.
* A module `PythonModule(name=test_scope, path=math_scope.py)` (red) is connected to the central module with an arrow.
**Lower Section:**
* The same five modules as in the upper section are displayed horizontally.
* The central module `PythonModule(name=utils/helpers, path=utils/helpers.py)` (yellow) is again present.
* Two modules are connected to the central module:
* `PythonModule(name=math_scope, path=math_scope.py)` (red)
* `PythonModule(name=basic, path=basic.py)` (light green)
**Text Label:**
* "Figure 14: Merged dependencies." is positioned centrally below the upper section.
### Key Observations
* The diagram illustrates a merging of dependencies. In the upper section, several modules depend directly on `utils/helpers.py`. In the lower section, `utils/helpers.py` depends on `math_scope.py` and `basic.py`.
* The color coding distinguishes between different types of modules (light green, yellow, red).
* The diagram suggests a refactoring or restructuring of dependencies, where the initial dependencies are consolidated through the `utils/helpers.py` module, and then further dependencies are introduced.
### Interpretation
The diagram depicts a dependency management scenario, likely within a software project. The "merged dependencies" suggest a process of consolidating multiple dependencies into a central module (`utils/helpers.py`). This central module then introduces new dependencies (`math_scope.py` and `basic.py`). This could represent a simplification of the dependency graph, or a change in the project's architecture. The use of different colors might indicate different categories of modules (e.g., core modules, utility modules, test modules). The diagram is a visual representation of how different parts of the code rely on each other, and how those relationships have evolved. The red module `math_scope.py` stands out as potentially being a testing or specialized module, given its distinct color. The diagram is a high-level overview and doesn't provide details about the specific functionality of each module.