## Line Chart: Test Time Search Performance on MATH500
### Overview
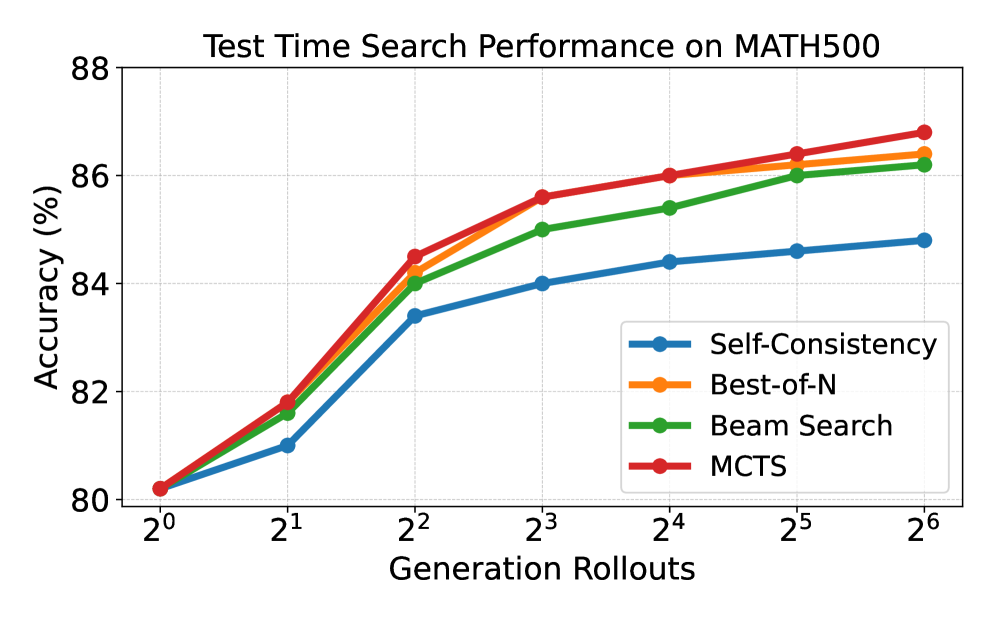
The image is a line chart comparing the test time search performance of four different methods (Self-Consistency, Best-of-N, Beam Search, and MCTS) on the MATH500 dataset. The x-axis represents the number of generation rollouts (ranging from 2^0 to 2^6), and the y-axis represents the accuracy in percentage.
### Components/Axes
* **Title:** Test Time Search Performance on MATH500
* **X-axis:**
* Label: Generation Rollouts
* Scale: Logarithmic, base 2. Markers at 2^0, 2^1, 2^2, 2^3, 2^4, 2^5, and 2^6.
* **Y-axis:**
* Label: Accuracy (%)
* Scale: Linear, ranging from 80 to 88. Markers at 80, 82, 84, 86, and 88.
* **Legend:** Located in the bottom-right corner of the chart.
* Self-Consistency (Blue)
* Best-of-N (Orange)
* Beam Search (Green)
* MCTS (Red)
### Detailed Analysis
* **Self-Consistency (Blue):** The line starts at approximately 80.2% at 2^0 rollouts, increases to approximately 81% at 2^1, then to 83.5% at 2^2, 84% at 2^3, 84.5% at 2^4, 84.6% at 2^5, and finally reaches approximately 84.8% at 2^6. The trend is generally upward, but the rate of increase slows down as the number of rollouts increases.
* **Best-of-N (Orange):** The line starts at approximately 80.2% at 2^0 rollouts, increases to approximately 81.8% at 2^1, then to 84.2% at 2^2, 85.2% at 2^3, 85.8% at 2^4, 86.2% at 2^5, and finally reaches approximately 86.4% at 2^6. The trend is generally upward, but the rate of increase slows down as the number of rollouts increases.
* **Beam Search (Green):** The line starts at approximately 80.2% at 2^0 rollouts, increases to approximately 81.8% at 2^1, then to 84% at 2^2, 85.4% at 2^3, 85.5% at 2^4, 86.1% at 2^5, and finally reaches approximately 86.2% at 2^6. The trend is generally upward, but the rate of increase slows down as the number of rollouts increases.
* **MCTS (Red):** The line starts at approximately 80.2% at 2^0 rollouts, increases to approximately 82% at 2^1, then to 84.5% at 2^2, 85.6% at 2^3, 86% at 2^4, 86.5% at 2^5, and finally reaches approximately 87% at 2^6. The trend is generally upward, but the rate of increase slows down as the number of rollouts increases.
### Key Observations
* All four methods show an increase in accuracy as the number of generation rollouts increases.
* MCTS consistently outperforms the other three methods across all rollout values.
* Self-Consistency consistently underperforms the other three methods across all rollout values.
* The performance gap between the methods narrows as the number of rollouts increases, suggesting diminishing returns.
### Interpretation
The chart demonstrates the impact of increasing generation rollouts on the test time search performance of different methods on the MATH500 dataset. The results suggest that MCTS is the most effective method for this task, achieving the highest accuracy across all rollout values. While all methods benefit from increased rollouts, the gains diminish as the number of rollouts increases, indicating a trade-off between computational cost and performance improvement. The consistent underperformance of Self-Consistency suggests that it may not be as well-suited for this particular task compared to the other methods.