\n
## Line Chart: Test Time Search Performance on MATH500
### Overview
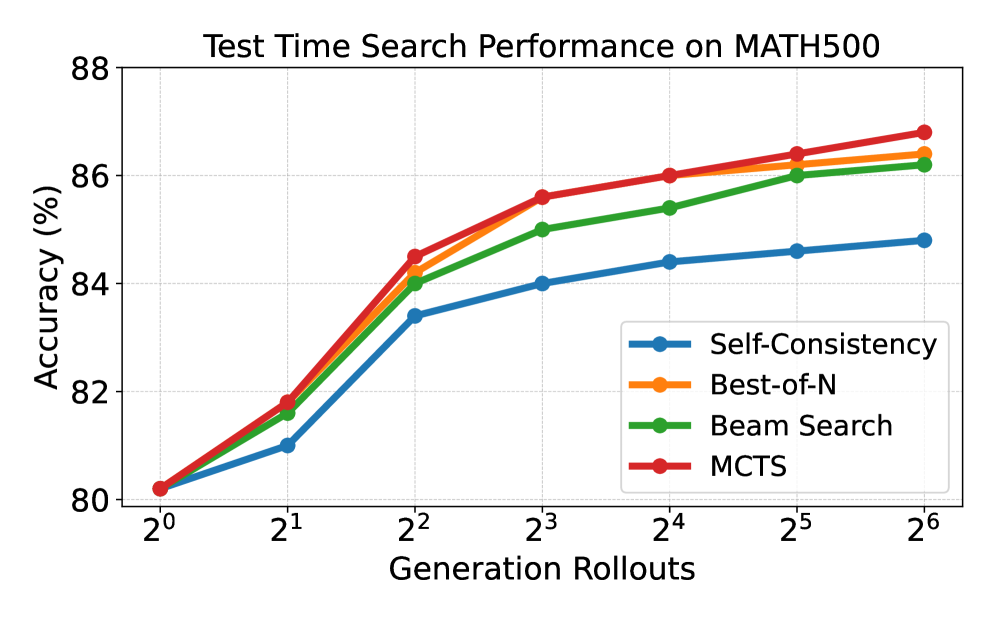
This line chart depicts the performance of four different search algorithms (Self-Consistency, Best-of-N, Beam Search, and MCTS) on the MATH500 dataset, measured by accuracy as a function of Generation Rollouts. The x-axis represents the number of Generation Rollouts, expressed as powers of 2 (from 2⁰ to 2⁶). The y-axis represents the Accuracy in percentage (from 80% to 88%).
### Components/Axes
* **Title:** "Test Time Search Performance on MATH500" (centered at the top)
* **X-axis Label:** "Generation Rollouts" (centered at the bottom)
* **X-axis Markers:** 2⁰, 2¹, 2², 2³, 2⁴, 2⁵, 2⁶
* **Y-axis Label:** "Accuracy (%)" (left side)
* **Y-axis Scale:** Linear, ranging from approximately 80% to 88% with increments of 2%.
* **Legend:** Located in the top-right corner.
* **Self-Consistency:** Blue line with circle markers.
* **Best-of-N:** Orange line with circle markers.
* **Beam Search:** Green line with circle markers.
* **MCTS:** Red line with circle markers.
### Detailed Analysis
* **Self-Consistency (Blue):** The line starts at approximately 80% at 2⁰, rises sharply to around 83% at 2¹, then plateaus, reaching approximately 85% at 2² and remaining relatively stable around 85% for the rest of the rollouts.
* **Best-of-N (Orange):** The line begins at approximately 80% at 2⁰, increases steadily to around 86% at 2³, and then plateaus, reaching approximately 87% at 2⁶.
* **Beam Search (Green):** The line starts at approximately 80% at 2⁰, increases rapidly to around 86% at 2³, and then plateaus, reaching approximately 86.5% at 2⁶.
* **MCTS (Red):** The line begins at approximately 80% at 2⁰, increases steadily to around 86.5% at 2³, and continues to increase, reaching approximately 87.5% at 2⁶.
Here's a breakdown of approximate accuracy values at each Generation Rollout:
| Generation Rollouts | Self-Consistency (%) | Best-of-N (%) | Beam Search (%) | MCTS (%) |
|---|---|---|---|---|
| 2⁰ | 80 | 80 | 80 | 80 |
| 2¹ | 83 | 82 | 82 | 82 |
| 2² | 85 | 84 | 84 | 84 |
| 2³ | 85 | 86 | 86 | 86.5 |
| 2⁴ | 85 | 86 | 86 | 86.5 |
| 2⁵ | 85 | 86 | 86 | 87 |
| 2⁶ | 85 | 87 | 86.5 | 87.5 |
### Key Observations
* All four algorithms start with the same accuracy at 2⁰.
* Self-Consistency shows the earliest plateau in performance.
* MCTS consistently achieves the highest accuracy, especially at higher Generation Rollouts.
* Best-of-N and Beam Search exhibit similar performance trends, plateauing around similar accuracy levels.
### Interpretation
The chart demonstrates the impact of increasing Generation Rollouts on the accuracy of different search algorithms for solving MATH500 problems. The algorithms initially show significant performance gains as the number of rollouts increases, indicating that exploring more possibilities improves solution quality. However, the gains diminish as the number of rollouts grows, suggesting a point of diminishing returns.
MCTS appears to be the most effective algorithm, consistently outperforming the others, particularly at higher rollout numbers. This suggests that MCTS's tree search strategy is well-suited for this type of problem. Self-Consistency, while simple, plateaus quickly, indicating it may not benefit as much from increased exploration. The similar performance of Best-of-N and Beam Search suggests they offer comparable trade-offs between exploration and computational cost.
The plateauing behavior of all algorithms indicates that the MATH500 problems may have inherent limitations in terms of how much accuracy can be achieved through search alone. Further improvements might require more sophisticated algorithms or problem-specific knowledge.