TECHNICAL ASSET FINGERPRINT
254f4c520f7467d9d884ca58
Click to view fullscreen
Press ESC or click to close
FOUND IN PAPERS
EXPERT: gemini-2.0-flash VERSION 1
RUNTIME: nugit/gemini/gemini-2.0-flash
INTEL_VERIFIED
## Chart: Average Attention Weight vs. Tokens
### Overview
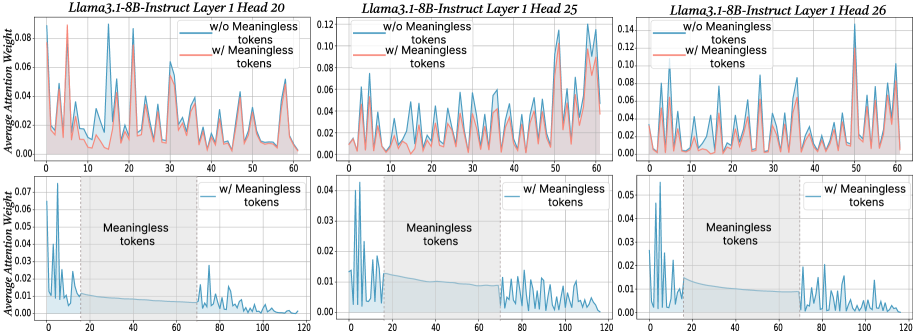
The image presents six line charts arranged in a 2x3 grid. Each chart displays the average attention weight against the number of tokens for different configurations of the Llama3.1-8B-Instruct model. The top row shows attention weights for a shorter sequence length (0-60 tokens), while the bottom row focuses on a longer sequence length (0-120 tokens), specifically highlighting the region of "meaningless tokens". The charts compare attention weights with and without meaningless tokens.
### Components/Axes
**General Chart Elements:**
* **Titles:** Each chart has a title indicating the model configuration (Llama3.1-8B-Instruct Layer 1 Head X, where X is 20, 25, or 26).
* **X-axis:** Represents the number of tokens. The top row charts range from 0 to 60 tokens, while the bottom row charts range from 0 to 120 tokens.
* **Y-axis:** Represents the average attention weight, ranging from 0.00 to varying maximum values (approximately 0.08, 0.12, and 0.14 for the top row, and approximately 0.07, 0.04, and 0.05 for the bottom row).
* **Legend:** Located in the top-right corner of each chart, indicating the two data series: "w/o Meaningless tokens" (blue line) and "w/ Meaningless tokens" (red line). The bottom row charts only display the "w/ Meaningless tokens" (blue line).
* **Grid:** All charts have a light gray grid in the background.
* **Meaningless Tokens Region:** The bottom row charts have a shaded gray region labeled "Meaningless tokens", spanning approximately from token 20 to token 70.
**Specific Axis Details:**
* **Top Row Y-Axis:**
* Left Chart (Head 20): 0.00 to 0.08, increments of 0.02
* Middle Chart (Head 25): 0.00 to 0.12, increments of 0.02
* Right Chart (Head 26): 0.00 to 0.14, increments of 0.02
* **Bottom Row Y-Axis:**
* Left Chart (Head 20): 0.00 to 0.07, increments of 0.01
* Middle Chart (Head 25): 0.00 to 0.04, increments of 0.01
* Right Chart (Head 26): 0.00 to 0.05, increments of 0.01
* **X-Axis (All Charts):** Increments of 10 tokens.
### Detailed Analysis
**Top Row Charts (0-60 Tokens):**
* **Llama3.1-8B-Instruct Layer 1 Head 20:**
* **w/o Meaningless tokens (blue):** The line fluctuates, showing several peaks and valleys. It generally stays above the "w/ Meaningless tokens" line.
* Peaks around token numbers: 5, 12, 18, 25, 30, 38, 45, 52, 58.
* Approximate peak values: 0.07, 0.06, 0.05, 0.06, 0.05, 0.06, 0.05, 0.06, 0.05.
* **w/ Meaningless tokens (red):** The line also fluctuates, but generally stays below the "w/o Meaningless tokens" line.
* Peaks around token numbers: 5, 12, 18, 25, 30, 38, 45, 52, 58.
* Approximate peak values: 0.04, 0.03, 0.03, 0.03, 0.03, 0.03, 0.03, 0.03, 0.03.
* **Llama3.1-8B-Instruct Layer 1 Head 25:**
* **w/o Meaningless tokens (blue):** The line fluctuates, showing several peaks and valleys. It generally stays above the "w/ Meaningless tokens" line.
* Peaks around token numbers: 5, 12, 18, 25, 30, 38, 45, 52, 58.
* Approximate peak values: 0.09, 0.08, 0.07, 0.08, 0.07, 0.08, 0.07, 0.08, 0.07.
* **w/ Meaningless tokens (red):** The line also fluctuates, but generally stays below the "w/o Meaningless tokens" line.
* Peaks around token numbers: 5, 12, 18, 25, 30, 38, 45, 52, 58.
* Approximate peak values: 0.06, 0.05, 0.05, 0.05, 0.05, 0.05, 0.05, 0.05, 0.05.
* **Llama3.1-8B-Instruct Layer 1 Head 26:**
* **w/o Meaningless tokens (blue):** The line fluctuates, showing several peaks and valleys. It generally stays above the "w/ Meaningless tokens" line.
* Peaks around token numbers: 5, 12, 18, 25, 30, 38, 45, 52, 58.
* Approximate peak values: 0.11, 0.10, 0.09, 0.10, 0.09, 0.10, 0.09, 0.10, 0.09.
* **w/ Meaningless tokens (red):** The line also fluctuates, but generally stays below the "w/o Meaningless tokens" line.
* Peaks around token numbers: 5, 12, 18, 25, 30, 38, 45, 52, 58.
* Approximate peak values: 0.08, 0.07, 0.07, 0.07, 0.07, 0.07, 0.07, 0.07, 0.07.
**Bottom Row Charts (0-120 Tokens):**
* **Llama3.1-8B-Instruct Layer 1 Head 20:**
* **w/ Meaningless tokens (blue):** The line starts with high peaks in the initial tokens (0-20), then rapidly decreases and stabilizes at a low level within the "Meaningless tokens" region (20-70). After the "Meaningless tokens" region, the line fluctuates again, showing smaller peaks.
* Initial peaks around token numbers: 2, 5, 8, 12, 15, 18.
* Approximate peak values: 0.07, 0.05, 0.04, 0.03, 0.02, 0.02.
* Stable value within "Meaningless tokens" region: ~0.01.
* Peaks after "Meaningless tokens" region around token numbers: 75, 85, 95, 105, 115.
* Approximate peak values: 0.01, 0.01, 0.01, 0.01, 0.01.
* **Llama3.1-8B-Instruct Layer 1 Head 25:**
* **w/ Meaningless tokens (blue):** The line starts with high peaks in the initial tokens (0-20), then rapidly decreases and stabilizes at a low level within the "Meaningless tokens" region (20-70). After the "Meaningless tokens" region, the line fluctuates again, showing smaller peaks.
* Initial peaks around token numbers: 2, 5, 8, 12, 15, 18.
* Approximate peak values: 0.04, 0.03, 0.02, 0.02, 0.01, 0.01.
* Stable value within "Meaningless tokens" region: ~0.005.
* Peaks after "Meaningless tokens" region around token numbers: 75, 85, 95, 105, 115.
* Approximate peak values: 0.005, 0.005, 0.005, 0.005, 0.005.
* **Llama3.1-8B-Instruct Layer 1 Head 26:**
* **w/ Meaningless tokens (blue):** The line starts with high peaks in the initial tokens (0-20), then rapidly decreases and stabilizes at a low level within the "Meaningless tokens" region (20-70). After the "Meaningless tokens" region, the line fluctuates again, showing smaller peaks.
* Initial peaks around token numbers: 2, 5, 8, 12, 15, 18.
* Approximate peak values: 0.05, 0.04, 0.03, 0.02, 0.02, 0.02.
* Stable value within "Meaningless tokens" region: ~0.01.
* Peaks after "Meaningless tokens" region around token numbers: 75, 85, 95, 105, 115.
* Approximate peak values: 0.01, 0.01, 0.01, 0.01, 0.01.
### Key Observations
* **Top Row:** The average attention weight is generally higher when meaningless tokens are excluded ("w/o Meaningless tokens"). Both lines fluctuate, indicating varying attention weights across different tokens.
* **Bottom Row:** The average attention weight drops significantly within the "Meaningless tokens" region, suggesting that the model pays less attention to these tokens. The initial tokens (0-20) show high attention weights, followed by a rapid decrease. After the "Meaningless tokens" region, the attention weights fluctuate again, but at a lower level than the initial tokens.
* **Head Variation:** The overall magnitude of attention weights varies across different heads (20, 25, and 26), with Head 26 generally showing the highest attention weights.
### Interpretation
The data suggests that the Llama3.1-8B-Instruct model assigns different attention weights to tokens based on their meaning. When meaningless tokens are included, the average attention weight is generally lower, indicating that the model is diluting its attention across a larger set of tokens, some of which are not informative.
The bottom row charts highlight the model's behavior when explicitly presented with a region of "meaningless tokens." The sharp drop in attention weight within this region confirms that the model is indeed recognizing and down-weighting these tokens. The initial high attention weights likely correspond to the more meaningful tokens at the beginning of the sequence, while the fluctuations after the "Meaningless tokens" region suggest that the model is attempting to re-engage with the remaining meaningful tokens.
The variation in attention weights across different heads (20, 25, and 26) indicates that different attention heads within the model are specialized for different aspects of the input sequence. Some heads may be more sensitive to meaningful tokens, while others may be more influenced by the presence of meaningless tokens.
DECODING INTELLIGENCE...