## Diagram: Modular Arithmetic Visualization
### Overview
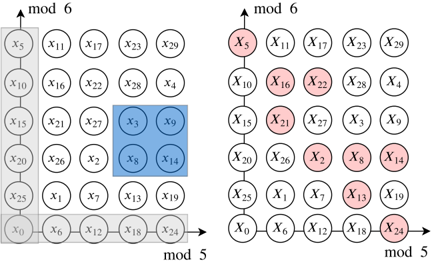
The image presents two diagrams illustrating modular arithmetic concepts. Both diagrams are arranged as 6x5 grids, with each cell containing a variable labeled 'x' with a subscript. The left diagram highlights specific elements with gray and blue shading, while the right diagram highlights different elements with red shading. The diagrams are labeled with "mod 6" on the vertical axis and "mod 5" on the horizontal axis.
### Components/Axes
* **Axes:**
* Vertical Axis (both diagrams): Labeled "mod 6".
* Horizontal Axis (both diagrams): Labeled "mod 5".
* **Grid:** Both diagrams consist of a 6x5 grid of cells.
* **Cells:** Each cell contains a variable 'x' with a subscript ranging from 0 to 29.
* **Shading (Left Diagram):**
* Gray: Highlights the leftmost column (x5, x10, x15, x20, x25, x0) and the bottom row (x0, x6, x12, x18, x24).
* Blue: Highlights a 2x2 square in the center (x3, x9, x8, x14).
* **Shading (Right Diagram):**
* Red: Highlights specific cells: x5, x16, x22, x21, x2, x8, x14, x13, x24.
### Detailed Analysis
**Left Diagram:**
* **Grid Structure:** A 6x5 grid with 'x' variables in each cell.
* **Gray Highlight:**
* Column: x5, x10, x15, x20, x25, x0.
* Row: x0, x6, x12, x18, x24.
* **Blue Highlight:**
* Square: x3, x9, x8, x14.
**Right Diagram:**
* **Grid Structure:** Identical 6x5 grid to the left diagram.
* **Red Highlight:**
* x5 (top-left)
* x16
* x22
* x21
* x2
* x8
* x14
* x13
* x24 (bottom-right)
### Key Observations
* The left diagram highlights modular arithmetic sequences along the axes and a central square.
* The right diagram highlights a seemingly arbitrary set of cells.
* Both diagrams share the same grid structure and variable assignments.
### Interpretation
The diagrams likely illustrate modular arithmetic principles. The left diagram visually represents the remainders when dividing by 5 (horizontal axis) and 6 (vertical axis). The gray shading emphasizes the elements that are congruent to 0 mod 5 and 0 mod 6. The blue square might represent a specific calculation or property within the modular system. The right diagram could be showing the result of a specific modular operation or a set of elements that satisfy a particular modular condition. Without additional context, the exact meaning of the red highlighted cells in the right diagram is unclear, but it likely represents a specific set of solutions or outcomes within the modular arithmetic system being visualized.