## Line Chart: Scaling verifier compute: ProcessBench
### Overview
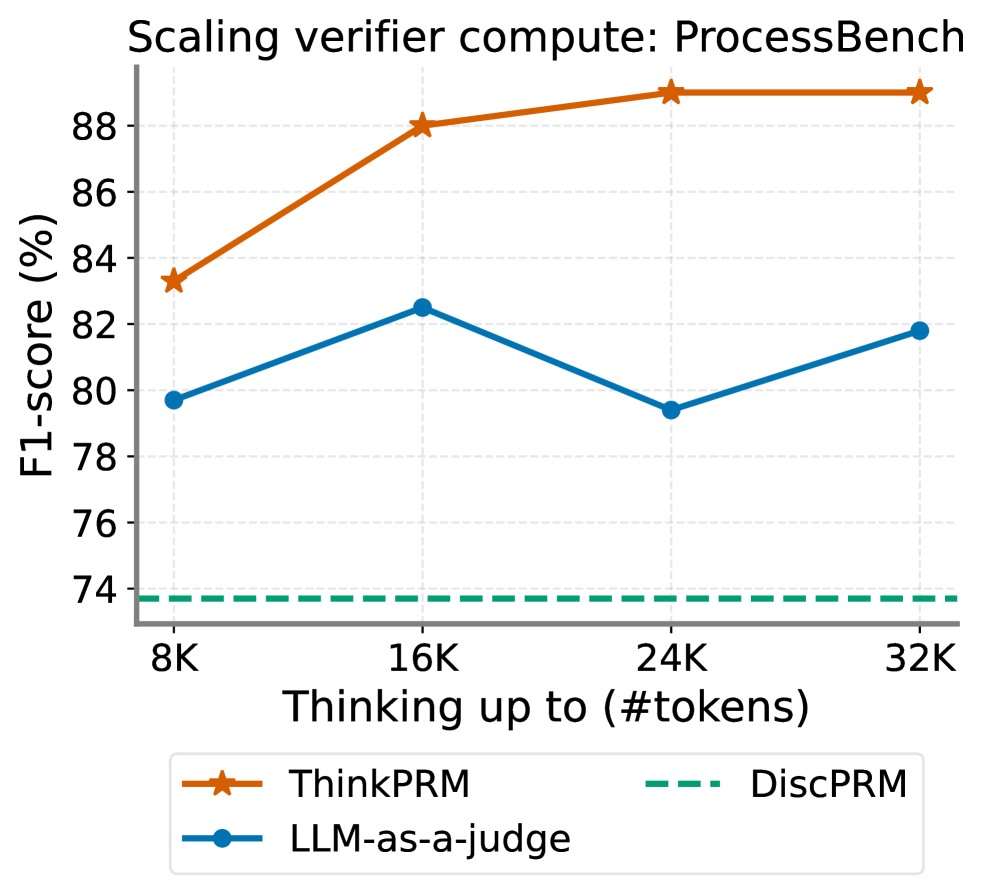
This image is a line chart titled "Scaling verifier compute: ProcessBench". It plots the performance, measured in F1-score (%), of three different verification methods against the amount of computational resources allocated for "thinking", measured in thousands of tokens (#tokens). The chart demonstrates how each method's performance scales as the token budget increases from 8K to 32K.
### Components/Axes
* **Title:** "Scaling verifier compute: ProcessBench" (Top center).
* **Y-Axis:** Labeled "F1-score (%)". The scale runs from 74 to 88, with major tick marks every 2 units (74, 76, 78, 80, 82, 84, 86, 88).
* **X-Axis:** Labeled "Thinking up to (#tokens)". The scale has four discrete points: 8K, 16K, 24K, and 32K.
* **Legend:** Located at the bottom center of the chart. It defines three data series:
* **ThinkPRM:** Represented by an orange solid line with star markers (★).
* **LLM-as-a-judge:** Represented by a blue solid line with circle markers (●).
* **DiscPRM:** Represented by a green dashed line (---).
### Detailed Analysis
**Data Series and Trends:**
1. **ThinkPRM (Orange line with stars):**
* **Trend:** Shows a strong, consistent upward trend that plateaus at higher token counts.
* **Data Points (Approximate):**
* At 8K tokens: ~83.3%
* At 16K tokens: ~88.0%
* At 24K tokens: ~89.0%
* At 32K tokens: ~89.0%
2. **LLM-as-a-judge (Blue line with circles):**
* **Trend:** Shows a non-monotonic, fluctuating trend. Performance increases, then decreases, then increases again.
* **Data Points (Approximate):**
* At 8K tokens: ~79.8%
* At 16K tokens: ~82.5%
* At 24K tokens: ~79.4%
* At 32K tokens: ~81.8%
3. **DiscPRM (Green dashed line):**
* **Trend:** Shows a perfectly flat, constant trend. Performance does not change with increased token budget.
* **Data Point (Approximate):** A constant value of ~73.8% across all token counts (8K, 16K, 24K, 32K).
### Key Observations
* **Performance Hierarchy:** ThinkPRM consistently outperforms the other two methods at every measured token budget. LLM-as-a-judge is the second-best performer, while DiscPRM is the lowest-performing method.
* **Scaling Behavior:** ThinkPRM demonstrates positive scaling, with significant gains from 8K to 16K tokens and diminishing returns thereafter. LLM-as-a-judge shows unstable scaling. DiscPRM shows zero scaling.
* **Convergence:** The performance gap between ThinkPRM and LLM-as-a-judge widens significantly after 16K tokens.
* **Baseline:** The DiscPRM line acts as a static baseline, highlighting the performance gains achieved by the other, compute-scaling methods.
### Interpretation
The chart provides a clear comparison of how different verification strategies utilize increased computational "thinking" budget. The data suggests that the **ThinkPRM** method is highly effective at converting additional compute into improved accuracy (F1-score), making it a strong candidate for scenarios where compute resources can be scaled. Its plateau after 16K tokens indicates a potential performance ceiling for this method on the ProcessBench task.
The **LLM-as-a-judge** method's fluctuating performance is anomalous. The dip at 24K tokens suggests it may be sensitive to specific token budget ranges or that its reasoning process becomes less reliable or more noisy at certain scales of computation. It does not reliably benefit from more compute in a linear fashion.
The **DiscPRM** method's flat line indicates it is not a compute-scaling verifier. Its performance is fixed, likely because it uses a deterministic or non-generative process that does not involve "thinking" with a variable token budget. It serves as a crucial baseline, showing the minimum performance level that the scaling methods must exceed.
In summary, the chart argues for the superiority of the ThinkPRM approach for this specific benchmark when additional compute is available, while cautioning that not all verification methods (like LLM-as-a-judge) scale predictably, and some (like DiscPRM) do not scale at all.