## Scatter Plot: Per-Task Success Rates: Real World vs World Model
### Overview
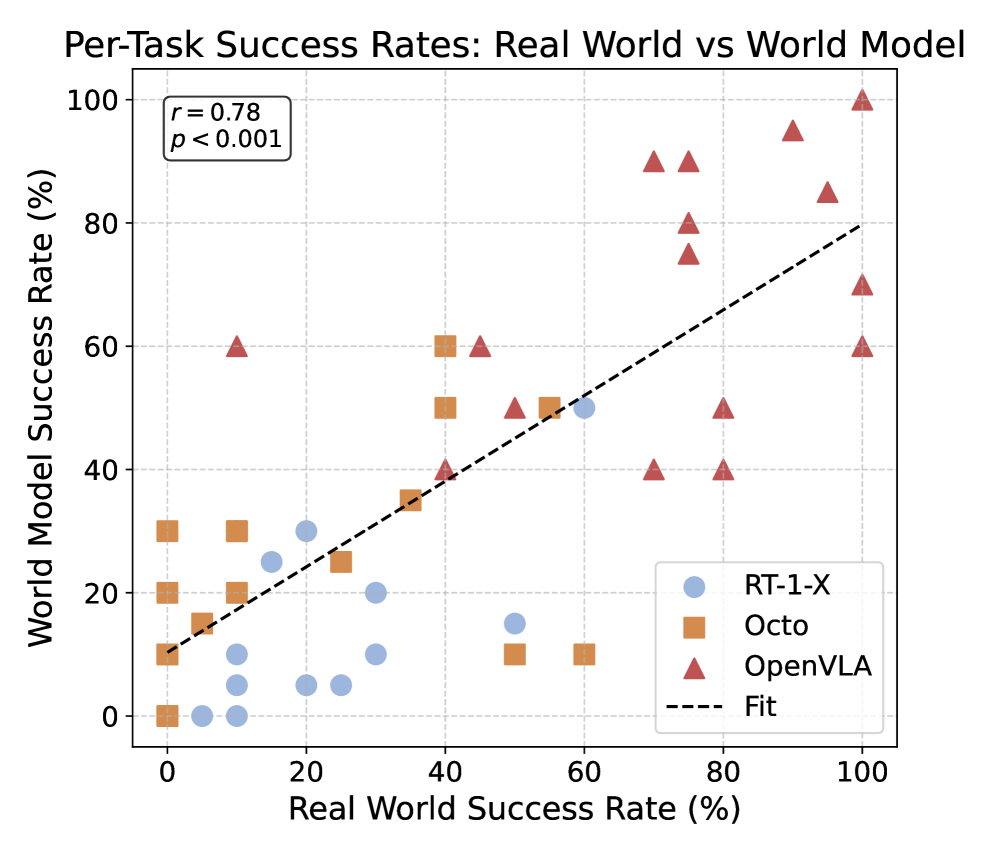
The image is a scatter plot comparing real-world success rates (x-axis) to world model success rates (y-axis) across three AI systems: RT-1-X, Octo, and OpenVLA. A dashed trend line (labeled "Fit") shows a strong positive correlation (r = 0.78, p < 0.001), indicating that higher real-world success rates generally correspond to higher model success rates.
### Components/Axes
- **X-axis**: Real World Success Rate (%)
- Scale: 0% (left) to 100% (right)
- Labels: Discrete ticks at 0, 20, 40, 60, 80, 100
- **Y-axis**: World Model Success Rate (%)
- Scale: 0% (bottom) to 100% (top)
- Labels: Discrete ticks at 0, 20, 40, 60, 80, 100
- **Legend**: Located in the bottom-right corner
- RT-1-X: Blue circles
- Octo: Orange squares
- OpenVLA: Red triangles
- **Trend Line**: Dashed black line labeled "Fit"
- Equation: Not explicitly provided
- Correlation: r = 0.78 (strong positive relationship)
- Significance: p < 0.001 (statistically significant)
### Detailed Analysis
1. **RT-1-X (Blue Circles)**
- **Positioning**: Clustered in the lower-left quadrant (real-world success: 0–40%, model success: 0–30%).
- **Trend**: Data points generally align below the trend line, suggesting underperformance relative to real-world success.
- **Outliers**: One point at (60%, 50%) deviates slightly above the trend line.
2. **Octo (Orange Squares)**
- **Positioning**: Spread across the plot, with concentrations near (20–60% real-world, 10–50% model success).
- **Trend**: Mixed alignment with the trend line; some points above (e.g., (40%, 40%)) and below (e.g., (20%, 10%)).
3. **OpenVLA (Red Triangles)**
- **Positioning**: Dominates the upper-right quadrant (real-world success: 60–100%, model success: 60–100%).
- **Trend**: Most points align closely with or above the trend line, indicating strong performance relative to real-world success.
- **Outliers**: One point at (80%, 70%) falls slightly below the trend line.
### Key Observations
- **Strong Correlation**: The trend line (r = 0.78) confirms a robust relationship between real-world and model success rates.
- **Model Performance**:
- OpenVLA consistently outperforms expectations (above the trend line).
- RT-1-X underperforms relative to real-world success (below the trend line).
- Octo shows moderate alignment with the trend line but higher variability.
- **Statistical Significance**: The p-value (< 0.001) rules out random chance as the cause of the correlation.
### Interpretation
The data demonstrates that world models trained on real-world data (e.g., OpenVLA) achieve higher success rates in tasks where real-world performance is high. RT-1-X, by contrast, struggles to match real-world outcomes, suggesting limitations in its training or architecture. The trend line’s slope implies that improving real-world success rates could directly enhance model performance, but the spread in data points (especially for Octo and OpenVLA) highlights task-specific variability. OpenVLA’s outlier at (80%, 70%) may indicate a task where real-world success is high but model performance lags, warranting further investigation. Overall, the plot underscores the importance of real-world data in training effective world models.