## Bar Charts: Distribution of LLM Calls Across Datasets
### Overview
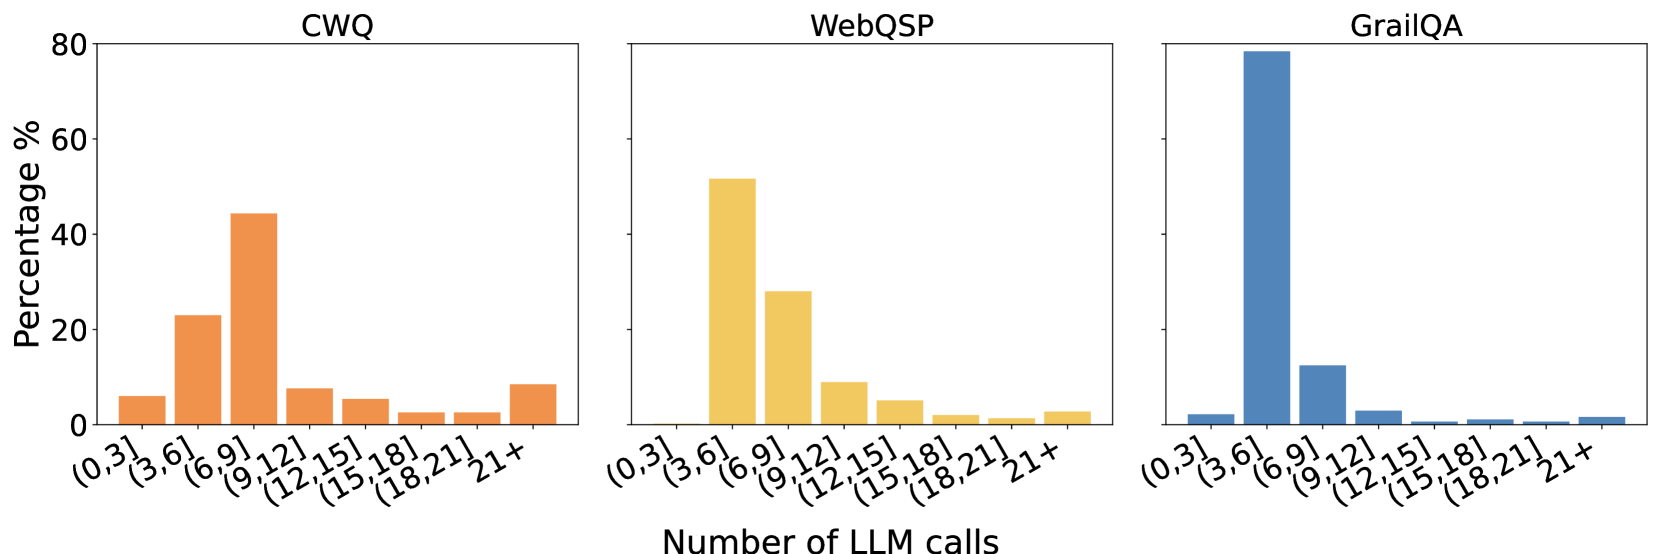
The image displays three bar charts side-by-side, each representing the distribution of "Number of LLM calls" for a different dataset: CWQ, WebQSP, and GrailQA. The y-axis of each chart indicates the "Percentage %", ranging from 0 to 80. The x-axis for all charts shows bins representing the number of LLM calls, from (0,3] to 21+. The charts use distinct colors for each dataset: orange for CWQ, yellow for WebQSP, and blue for GrailQA.
### Components/Axes
**Common Elements:**
* **Y-axis Title:** "Percentage %"
* **Y-axis Scale:** 0, 20, 40, 60, 80
* **X-axis Title:** "Number of LLM calls"
* **X-axis Categories (Bins):** (0,3], (3,6], (6,9], (9,12], (12,15], (15,18], (18,21], 21+
**Individual Chart Titles:**
* **Left Chart:** CWQ
* **Middle Chart:** WebQSP
* **Right Chart:** GrailQA
### Detailed Analysis
**CWQ (Orange Bars):**
* **(0,3]:** Approximately 8%
* **(3,6]:** Approximately 23%
* **(6,9]:** Approximately 10%
* **(9,12]:** Approximately 44% (Peak)
* **(12,15]:** Approximately 8%
* **(15,18]:** Approximately 4%
* **(18,21]:** Approximately 2%
* **21+:** Approximately 5%
**WebQSP (Yellow Bars):**
* **(0,3]:** Approximately 2%
* **(3,6]:** Approximately 50% (Peak)
* **(6,9]:** Approximately 27%
* **(9,12]:** Approximately 8%
* **(12,15]:** Approximately 4%
* **(15,18]:** Approximately 2%
* **(18,21]:** Approximately 1%
* **21+:** Approximately 1%
**GrailQA (Blue Bars):**
* **(0,3]:** Approximately 1%
* **(3,6]:** Approximately 80% (Peak)
* **(6,9]:** Approximately 13%
* **(9,12]:** Approximately 3%
* **(12,15]:** Approximately 1%
* **(15,18]:** Approximately 0.5%
* **(18,21]:** Approximately 0.5%
* **21+:** Approximately 0.5%
### Key Observations
* **GrailQA:** Exhibits a highly skewed distribution, with an overwhelming majority of instances (approximately 80%) requiring between 3 and 6 LLM calls. The number of calls drops sharply for higher bins.
* **WebQSP:** Shows a peak in the (3,6] bin (approximately 50%), followed by a significant secondary peak in the (6,9] bin (approximately 27%). The distribution tapers off more gradually than GrailQA.
* **CWQ:** Has its highest peak in the (9,12] bin (approximately 44%), with a notable secondary peak in the (3,6] bin (approximately 23%). The distribution is more spread out compared to the other two datasets.
* **Common Trend:** All three datasets show a general decreasing trend in the percentage of LLM calls as the number of calls increases beyond the primary peak.
### Interpretation
These bar charts illustrate the varying complexity of questions or tasks across different datasets, as measured by the number of Language Model (LLM) calls required for their resolution.
* **GrailQA** appears to be the "simplest" or most direct dataset in terms of LLM interaction, with most instances requiring a very small, consistent number of calls (3-6). This suggests that the tasks in GrailQA are relatively straightforward and can be answered with minimal iterative LLM engagement.
* **WebQSP** presents a moderate level of complexity. While a significant portion of tasks are resolved within 3-6 calls, there's a substantial secondary group that requires more calls (6-9). This indicates a mix of simpler and moderately complex tasks.
* **CWQ** demonstrates the highest complexity among the three. Its distribution is more spread out, with a substantial number of instances requiring a higher number of LLM calls (9-12). This suggests that tasks in CWQ might involve more intricate reasoning, multi-step processes, or require more refinement through LLM interactions.
In essence, the charts provide a quantitative measure of the "effort" or "computational cost" (in terms of LLM calls) associated with processing data from each dataset. This information is crucial for understanding the performance characteristics and resource requirements of LLM-based systems when applied to these different domains. The distinct distributions highlight that a one-size-fits-all approach to LLM interaction might not be optimal across all datasets.