\n
## Chart: Current vs. Time for LRS and HRS
### Overview
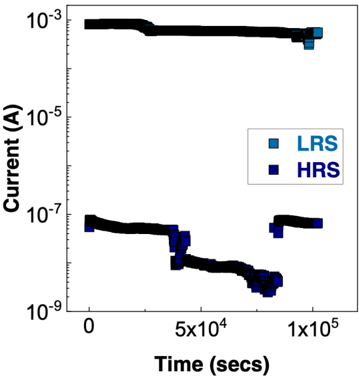
The image presents a chart displaying the relationship between Current (in Amperes) and Time (in seconds) for two states: Low Resistance State (LRS) and High Resistance State (HRS). The data is presented as a series of connected points, suggesting a time-dependent measurement. There are two distinct curves, one representing LRS and the other HRS.
### Components/Axes
* **X-axis:** Time (secs), ranging from approximately 0 to 1 x 10<sup>5</sup> seconds. The scale is logarithmic.
* **Y-axis:** Current (A), ranging from 10<sup>-9</sup> to 10<sup>-3</sup> Amperes. The scale is logarithmic.
* **Legend:** Located in the top-right corner.
* LRS (Light Blue squares)
* HRS (Dark Blue squares)
### Detailed Analysis
**HRS (Dark Blue Squares):**
The HRS curve begins at approximately 7 x 10<sup>-8</sup> A at time 0. It remains relatively stable until approximately 5 x 10<sup>4</sup> seconds, where it begins to decrease. The current drops rapidly to approximately 2 x 10<sup>-9</sup> A at around 7.5 x 10<sup>4</sup> seconds. After this drop, the current increases again to approximately 1 x 10<sup>-7</sup> A at 1 x 10<sup>5</sup> seconds.
**LRS (Light Blue Squares):**
The LRS curve starts at approximately 2 x 10<sup>-3</sup> A at time 0. It exhibits a slight downward trend, decreasing to approximately 1 x 10<sup>-3</sup> A by 5 x 10<sup>4</sup> seconds. The current then increases slightly to approximately 1.5 x 10<sup>-3</sup> A at 1 x 10<sup>5</sup> seconds.
### Key Observations
* The HRS exhibits a significant drop in current around 7.5 x 10<sup>4</sup> seconds, followed by a slight recovery.
* The LRS maintains a significantly higher current level throughout the measured time period compared to the HRS.
* Both curves show some degree of fluctuation, but the HRS curve demonstrates a more pronounced change in current.
* The logarithmic scales on both axes compress the data, making it difficult to discern precise values without closer inspection.
### Interpretation
The chart likely represents the behavior of a resistive switching memory device (e.g., memristor). The LRS and HRS correspond to the two distinct resistance states of the device. The observed switching behavior – the drop in current for HRS – suggests a transition between these states. The data indicates that the device can be switched from a high resistance state to a low resistance state and back again, demonstrating its non-volatile memory capability. The fluctuations in current could be due to noise, measurement errors, or inherent device variability. The time scale suggests that the switching process occurs on the order of tens of thousands of seconds. The large difference in current between LRS and HRS indicates a substantial difference in resistance, which is crucial for reliable memory operation. The initial stability of the HRS before the drop suggests a holding time or a threshold for switching.