## Diagram: Taxonomy of LS (Labeling Scheme) Variants
### Overview
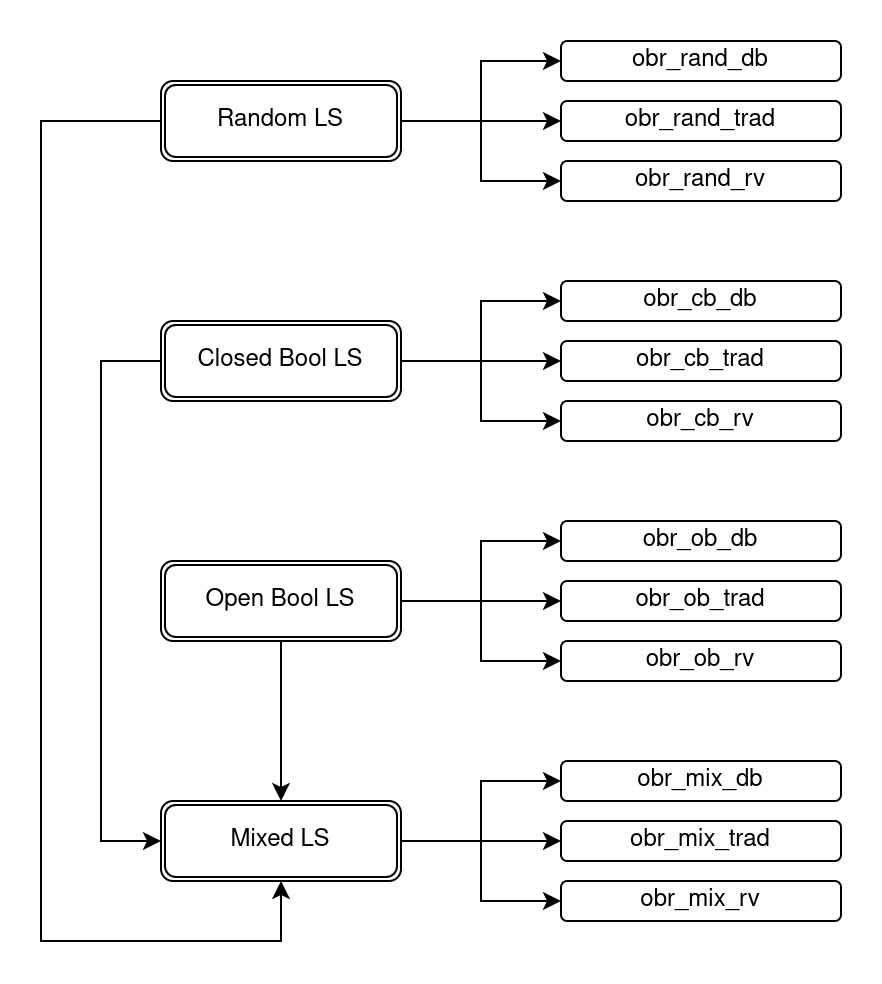
The image is a hierarchical flowchart or taxonomy diagram illustrating four primary categories of "LS" (likely an acronym for "Labeling Scheme" or similar technical term) and their respective sub-variants. The diagram uses a tree structure with rounded rectangular nodes connected by directional arrows to show relationships and derivations.
### Components/Axes
The diagram is organized into two main columns:
* **Left Column (Primary Categories):** Contains four vertically aligned, double-bordered rounded rectangles. From top to bottom, they are labeled:
1. `Random LS`
2. `Closed Bool LS`
3. `Open Bool LS`
4. `Mixed LS`
* **Right Column (Sub-variants):** Contains twelve single-bordered rounded rectangles, grouped in sets of three. Each set is horizontally aligned with and connected to a primary category on the left. The labels follow a consistent naming pattern: `obr_[type]_[variant]`.
**Legend/Key:** There is no separate legend. The naming convention itself acts as a key:
* `obr_`: A common prefix for all sub-variant labels.
* `[type]`: Corresponds to the primary category (`rand`, `cb`, `ob`, `mix`).
* `[variant]`: One of three suffixes: `db`, `trad`, or `rv`.
**Spatial Grounding & Flow:**
* The primary categories are positioned in a vertical stack on the left side of the diagram.
* Each primary category has a rightward-pointing arrow that branches into three separate arrows, each leading to one of its three sub-variants on the right.
* There are two additional directional arrows indicating relationships between primary categories:
1. A downward arrow from `Open Bool LS` to `Mixed LS`.
2. An upward arrow from the bottom of the main vertical connecting line (which links all primary categories) to `Mixed LS`.
### Detailed Analysis / Content Details
**Complete Node Inventory:**
1. **Primary Category: Random LS**
* Sub-variant 1: `obr_rand_db`
* Sub-variant 2: `obr_rand_trad`
* Sub-variant 3: `obr_rand_rv`
2. **Primary Category: Closed Bool LS**
* Sub-variant 1: `obr_cb_db`
* Sub-variant 2: `obr_cb_trad`
* Sub-variant 3: `obr_cb_rv`
3. **Primary Category: Open Bool LS**
* Sub-variant 1: `obr_ob_db`
* Sub-variant 2: `obr_ob_trad`
* Sub-variant 3: `obr_ob_rv`
4. **Primary Category: Mixed LS**
* Sub-variant 1: `obr_mix_db`
* Sub-variant 2: `obr_mix_trad`
* Sub-variant 3: `obr_mix_rv`
**Relationship Flow:**
* The primary relationship is a one-to-three mapping from each LS type to its specific implementation variants (`db`, `trad`, `rv`).
* The secondary arrows suggest that `Mixed LS` is derived from or related to both `Open Bool LS` and the overarching system connecting all LS types.
### Key Observations
* **Consistent Structure:** Every primary category has exactly three sub-variants, following the identical `db`, `trad`, `rv` pattern.
* **Naming Convention:** The labels are highly systematic, using underscores and abbreviations (`cb` for Closed Bool, `ob` for Open Bool, `mix` for Mixed).
* **Unique Position of Mixed LS:** `Mixed LS` is the only primary category that receives input arrows from two sources (`Open Bool LS` and the main vertical line), indicating it may be a composite or hybrid type.
* **Visual Hierarchy:** The use of double borders for primary categories and single borders for sub-variants clearly establishes a parent-child relationship.
### Interpretation
This diagram represents a **classification system for technical labeling schemes (LS)**. It suggests a research or engineering context where different foundational approaches to labeling (Random, Closed Boolean, Open Boolean) are explored, each leading to three concrete implementation variants (likely standing for "database," "traditional," and "reverse" or similar technical terms).
The structure implies that "Mixed LS" is not a fundamental type like the others but is instead a **synthesis or combination** derived from the "Open Bool LS" approach and potentially incorporating elements from the entire LS family (as indicated by the arrow from the main vertical connector). This makes "Mixed LS" a potentially more complex or advanced scheme.
The diagram's purpose is to provide a clear, visual taxonomy for navigating different LS options and understanding their provenance. It would be essential for documentation in fields like database theory, data modeling, or formal verification where such labeling schemes are used. The absence of numerical data indicates this is a conceptual or architectural map rather than a performance comparison.