## Line Chart: Differentiable Parameter Learning with 1 label
### Overview
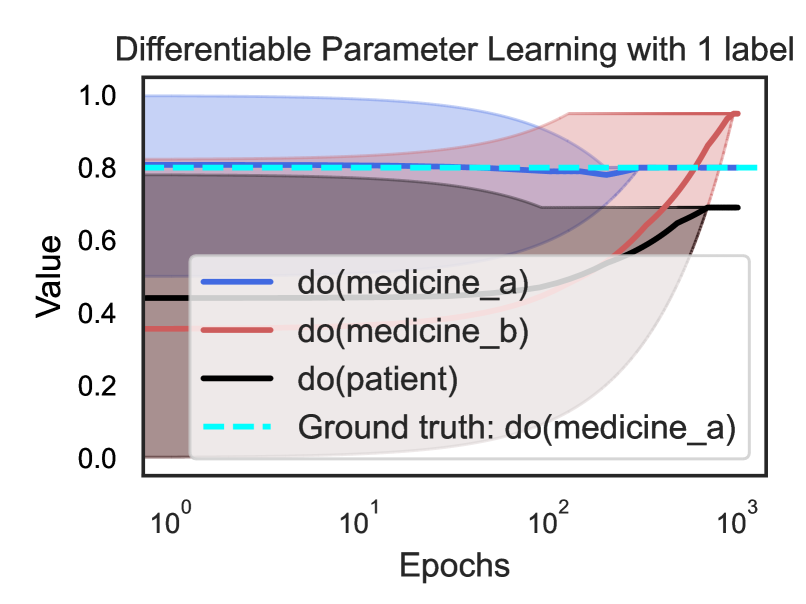
The image is a line chart titled "Differentiable Parameter Learning with 1 label". It displays the change in "Value" over "Epochs" for three different interventions: "do(medicine_a)", "do(medicine_b)", and "do(patient)", along with a "Ground truth" line for "do(medicine_a)". The x-axis (Epochs) is on a logarithmic scale.
### Components/Axes
* **Title:** Differentiable Parameter Learning with 1 label
* **X-axis:**
* Label: Epochs
* Scale: Logarithmic (base 10)
* Markers: 10⁰, 10¹, 10², 10³
* **Y-axis:**
* Label: Value
* Scale: Linear
* Markers: 0.0, 0.2, 0.4, 0.6, 0.8, 1.0
* **Legend:** Located in the center of the chart.
* Blue line: do(medicine\_a)
* Red line: do(medicine\_b)
* Black line: do(patient)
* Cyan dashed line: Ground truth: do(medicine\_a)
### Detailed Analysis
* **do(medicine\_a) (Blue):** The blue line starts at a value of approximately 1.0 and decreases slightly to around 0.8 between 10¹ and 10².
* At Epoch 10⁰: Value ≈ 1.0
* At Epoch 10¹: Value ≈ 0.95
* At Epoch 10²: Value ≈ 0.8
* At Epoch 10³: Value ≈ 0.8
* **do(medicine\_b) (Red):** The red line starts at a value of approximately 0.35, remains relatively constant until around 10², and then increases sharply to approximately 0.95 at 10³.
* At Epoch 10⁰: Value ≈ 0.35
* At Epoch 10¹: Value ≈ 0.35
* At Epoch 10²: Value ≈ 0.35
* At Epoch 10³: Value ≈ 0.95
* **do(patient) (Black):** The black line starts at a value of approximately 0.45 and increases gradually to approximately 0.7 at 10³.
* At Epoch 10⁰: Value ≈ 0.45
* At Epoch 10¹: Value ≈ 0.45
* At Epoch 10²: Value ≈ 0.6
* At Epoch 10³: Value ≈ 0.7
* **Ground truth: do(medicine\_a) (Cyan Dashed):** The cyan dashed line remains constant at a value of approximately 0.8 across all epochs.
* At Epoch 10⁰: Value ≈ 0.8
* At Epoch 10¹: Value ≈ 0.8
* At Epoch 10²: Value ≈ 0.8
* At Epoch 10³: Value ≈ 0.8
### Key Observations
* "do(medicine\_a)" starts with a high value and decreases slightly.
* "do(medicine\_b)" shows a significant increase in value after 10² epochs.
* "do(patient)" shows a gradual increase in value over the epochs.
* "Ground truth: do(medicine\_a)" remains constant throughout the epochs.
### Interpretation
The chart illustrates the learning process of different interventions over epochs. "do(medicine\_b)" shows a delayed but significant improvement, suggesting it might require more epochs to reach its potential. "do(patient)" shows a steady but less dramatic improvement. "do(medicine\_a)" starts with a high value, possibly indicating a good initial state, but its value decreases slightly over time. The "Ground truth" line serves as a benchmark for the "do(medicine\_a)" intervention, indicating that the learned parameter for "do(medicine\_a)" converges towards the ground truth value after a certain number of epochs. The shaded regions around each line likely represent the uncertainty or variance in the learning process.