## Line Chart: Differentiable Parameter Learning with 1 label
### Overview
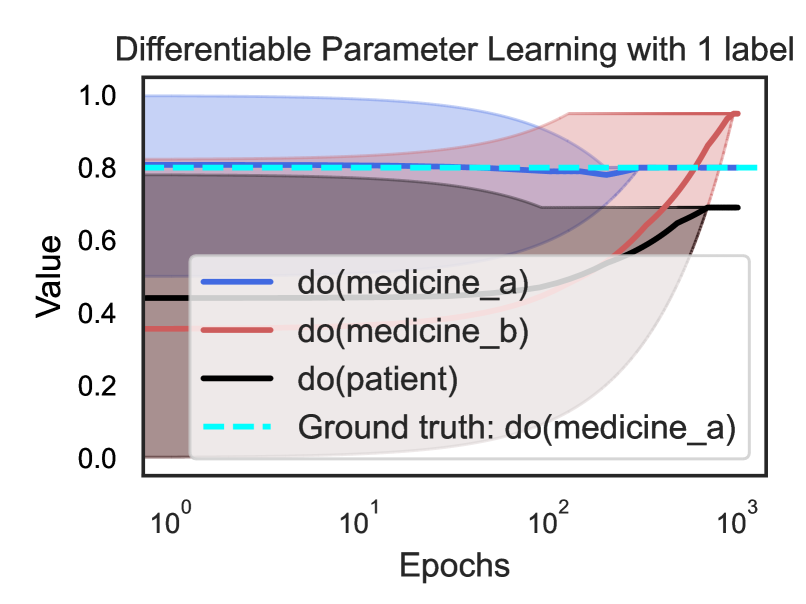
This is a line chart with shaded confidence intervals, illustrating the learning progression of different causal parameters over training epochs. The chart compares the estimated values of three interventions against a known ground truth. The x-axis uses a logarithmic scale.
### Components/Axes
* **Title:** "Differentiable Parameter Learning with 1 label"
* **Y-axis:** Label is "Value". Scale is linear, ranging from 0.0 to 1.0 with major ticks at 0.0, 0.2, 0.4, 0.6, 0.8, and 1.0.
* **X-axis:** Label is "Epochs". Scale is logarithmic (base 10), with major ticks at 10⁰ (1), 10¹ (10), 10² (100), and 10³ (1000).
* **Legend:** Positioned in the bottom-right quadrant of the chart area, partially overlapping the data lines. It contains four entries:
1. `do(medicine_a)`: Solid blue line.
2. `do(medicine_b)`: Solid red line.
3. `do(patient)`: Solid black line.
4. `Ground truth: do(medicine_a)`: Cyan dashed line.
* **Data Series:** Each solid line is accompanied by a semi-transparent shaded area of the same color, representing a confidence interval or variance band.
### Detailed Analysis
**Trend Verification & Data Points (Approximate):**
* **`do(medicine_a)` (Blue Line):** Starts high (~0.8 at epoch 1), remains relatively flat with a slight dip around epoch 100 (~0.78), then rises sharply after epoch 100 to converge near ~0.95 by epoch 1000. The blue shaded confidence interval is very wide at the start (spanning ~0.4 to 1.0) and narrows significantly as epochs increase.
* **`do(medicine_b)` (Red Line):** Starts lower (~0.4 at epoch 1), shows a steady, accelerating upward trend. It crosses the blue line between epoch 100 and 1000 and converges to the same final value (~0.95) by epoch 1000. Its red shaded confidence interval widens considerably as epochs increase, especially after epoch 100.
* **`do(patient)` (Black Line):** Starts around ~0.45 at epoch 1, remains nearly flat until epoch 100, then increases to a final value of approximately ~0.7 by epoch 1000. Its black shaded confidence interval is narrow initially but widens notably in the later epochs.
* **`Ground truth: do(medicine_a)` (Cyan Dashed Line):** A constant horizontal line at y = 0.8 across all epochs.
**Spatial Grounding:** The legend is placed in the bottom-right, obscuring the lower portions of the rising red and black lines in the later epochs. The cyan ground truth line is clearly visible above the initial values of the red and black lines.
### Key Observations
1. **Convergence:** Both `do(medicine_a)` and `do(medicine_b)` converge to a value (~0.95) that is higher than the stated ground truth (0.8) for `do(medicine_a)`.
2. **Diverging Uncertainty:** The confidence intervals for `do(medicine_a)` and `do(medicine_b)` behave oppositely. Uncertainty for medicine_a decreases with more training, while uncertainty for medicine_b increases.
3. **Baseline Performance:** The `do(patient)` parameter, likely representing a baseline or control, shows the least improvement and ends at the lowest value.
4. **Learning Dynamics:** The most significant changes for all parameters occur after epoch 100 (10²), suggesting a critical phase in the learning process.
### Interpretation
This chart likely visualizes a causal inference or reinforcement learning experiment where an algorithm is learning the effect of different interventions (`do(medicine_a)`, `do(medicine_b)`) on a patient outcome, using limited labeled data (1 label).
* **What the data suggests:** The model successfully learns that both medicine interventions have a strong positive effect, eventually surpassing the known ground truth value for medicine_a. This could indicate model overestimation, or that the ground truth represents a different context. The steady rise of medicine_b suggests it is a viable alternative that the model learns to value equally.
* **Relationship between elements:** The ground truth serves as a benchmark. The patient line acts as a baseline. The crossing of the blue and red lines indicates a point in training where the model's estimate of medicine_b's effectiveness surpasses that of medicine_a.
* **Notable Anomalies:** The primary anomaly is the final estimated value for `do(medicine_a)` exceeding its own ground truth. The widening confidence interval for `do(medicine_b)` is also notable, suggesting the model becomes less certain about this parameter's value even as its mean estimate improves, possibly due to conflicting signals in the data. The chart demonstrates the model's ability to differentiate and learn distinct parameters, but also highlights potential issues with calibration or uncertainty quantification.