## Blood Analysis Table: Dietary Glycan Effects on Cholesterol and Triglycerides in Rats
### Overview
The image presents a table of blood analysis results from a study on the effects of dietary glycan on cholesterol and triglyceride levels in rats. Three groups of rats were tested, with measurements taken for cholesterol at 0 weeks and triglycerides at 4 weeks.
### Components/Axes
* **Title:** The Ability of Dietary Glycan to Lower Elevated Blood Cholesterol and Triglycerides in Rats.
* **Date:** June 18, 1975
* **Groups:** #1, #2 (labeled as #2 a), #3 (labeled as #3 b)
* **Measurements:**
* Cholesterol mg % 0 Wk. (Cholesterol levels in milligrams per percent at 0 weeks)
* Triglyceride mg % 4 Wk. (Triglyceride levels in milligrams per percent at 4 weeks)
* **Source:** https://www.industrydocuments.ucsf.edu/docs/hnhd0227
### Detailed Analysis or ### Content Details
**Experimental Setup:**
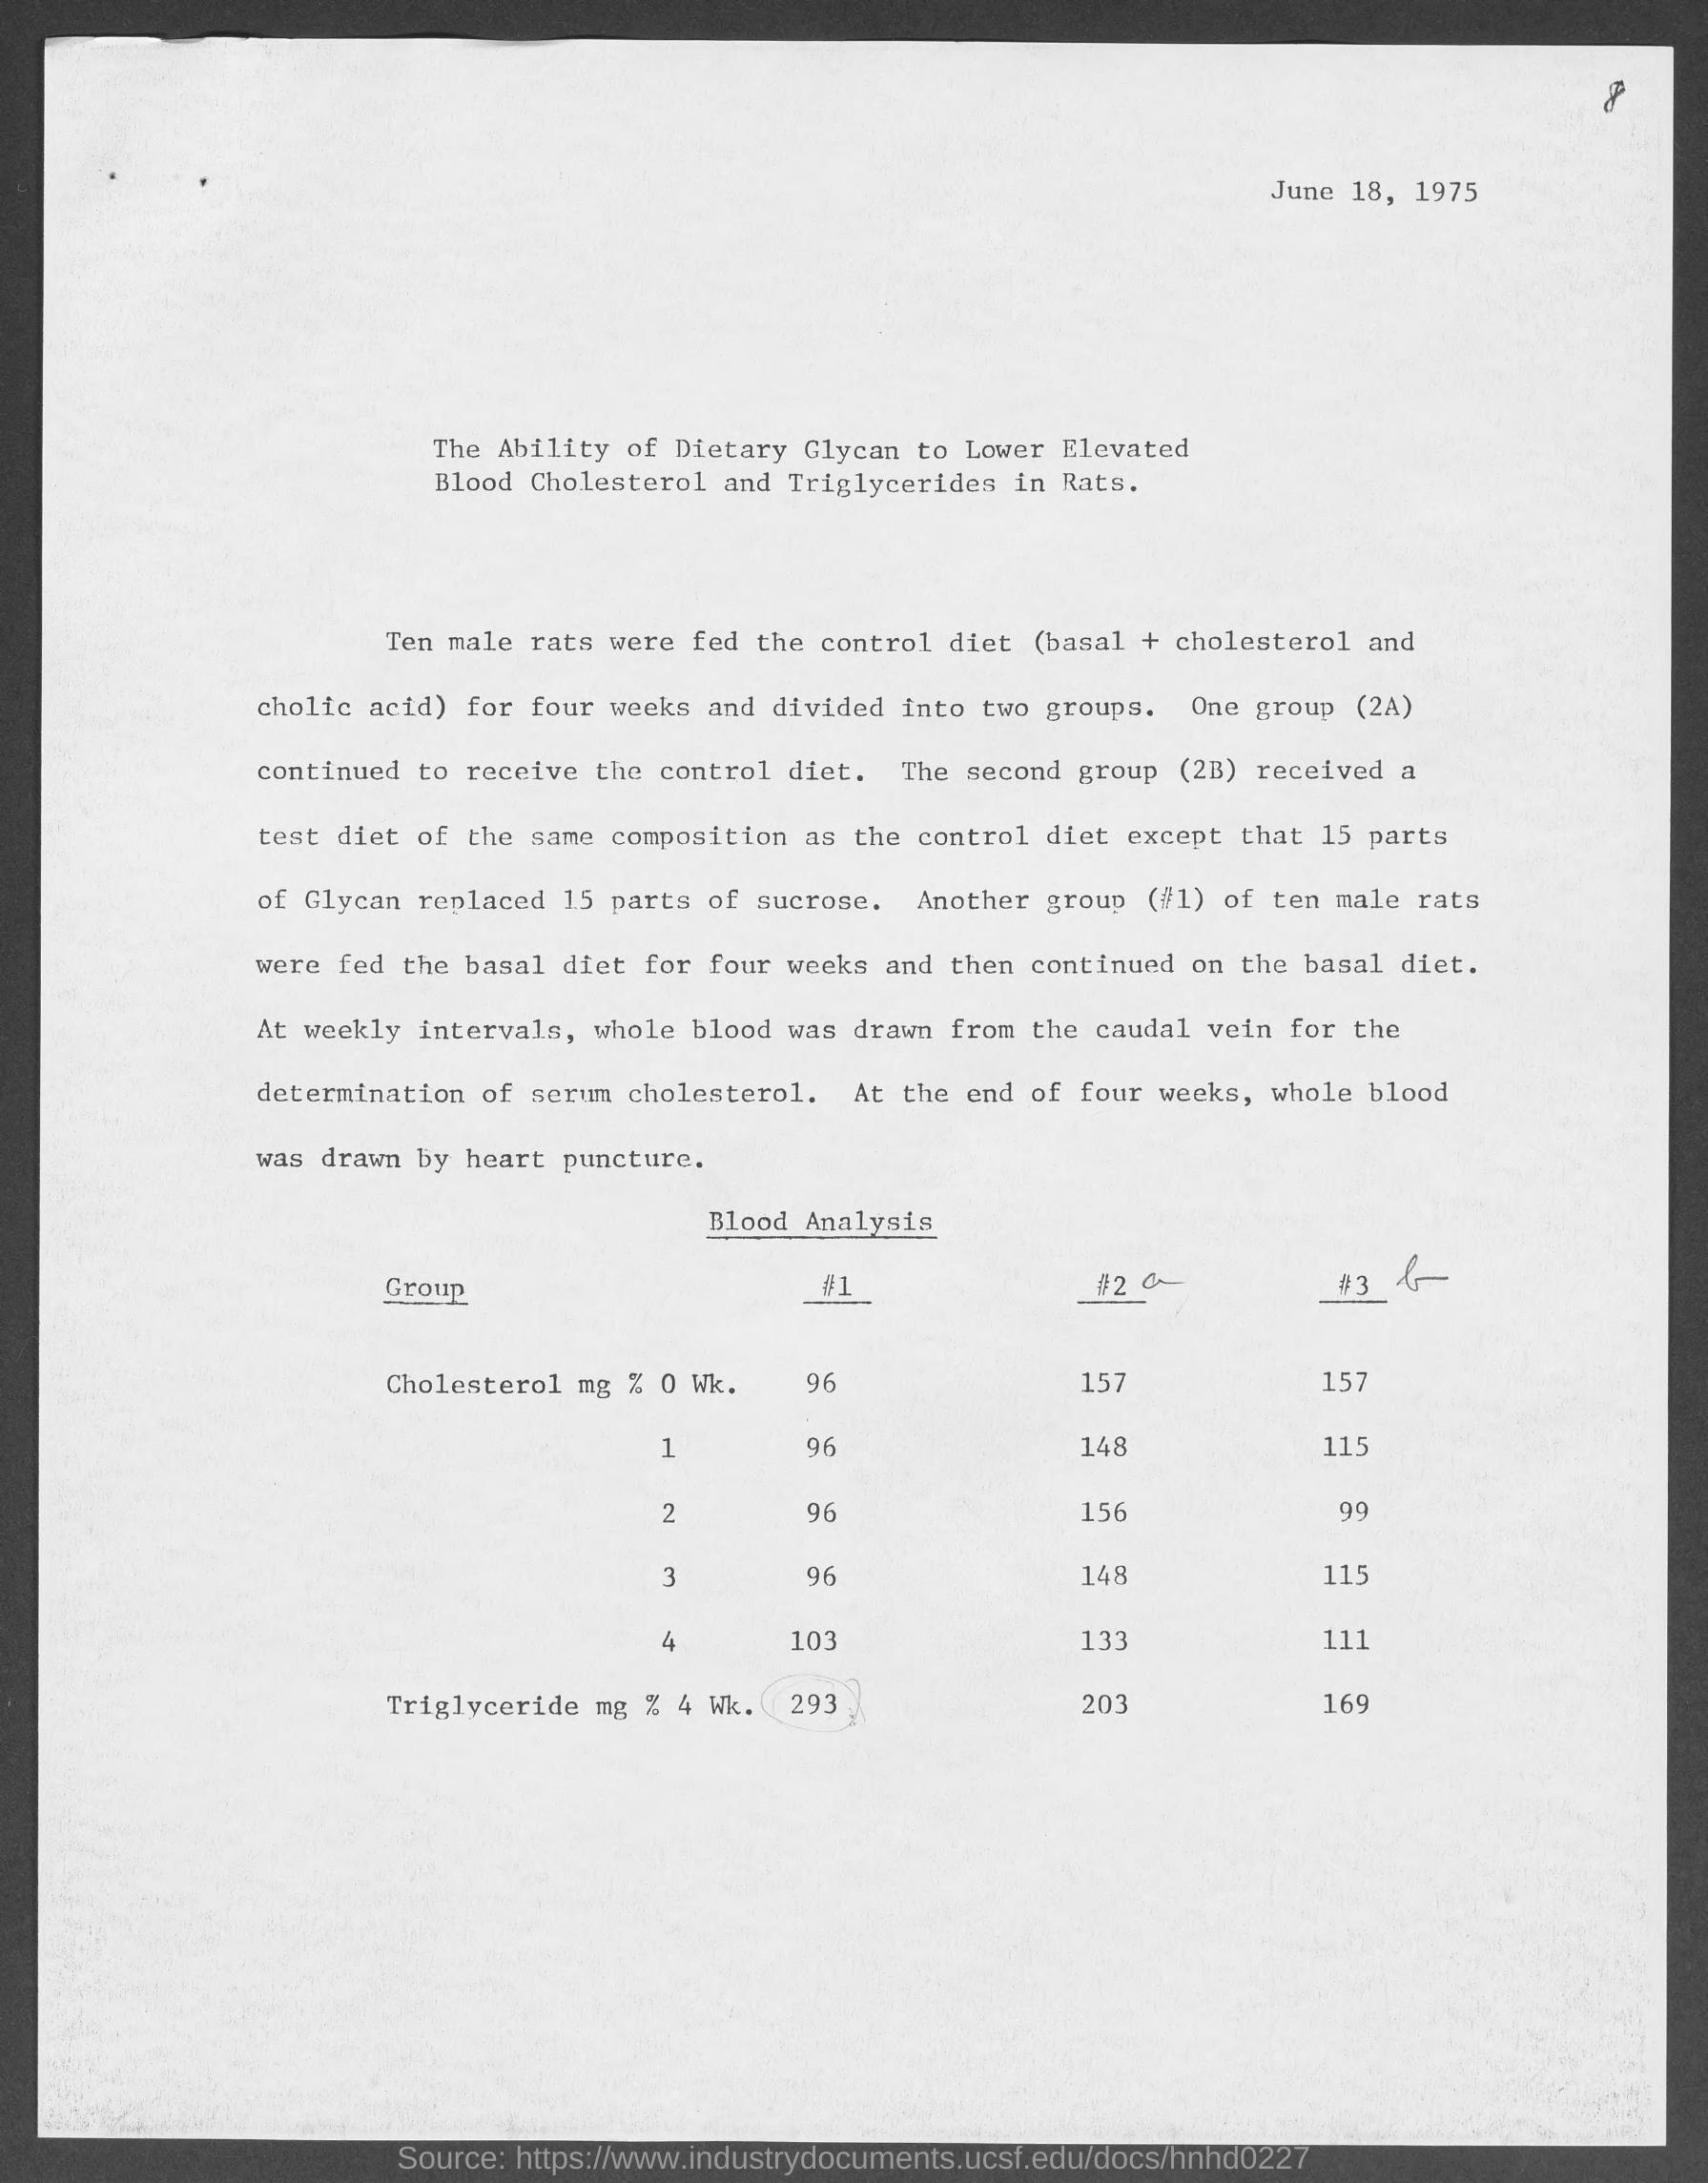
* Ten male rats were fed the control diet (basal + cholesterol and cholic acid) for four weeks and divided into two groups.
* Group (2A) continued to receive the control diet.
* Group (2B) received a test diet of the same composition as the control diet except that 15 parts of Glycan replaced 15 parts of sucrose.
* Another group (#1) of ten male rats were fed the basal diet for four weeks and then continued on the basal diet.
* At weekly intervals, whole blood was drawn from the caudal vein for the determination of serum cholesterol.
* At the end of four weeks, whole blood was drawn by heart puncture.
**Data Table:**
| Group | #1 | #2 a | #3 b |
| ---------------------- | --- | ---- | ---- |
| Cholesterol mg % 0 Wk. | | | |
| 1 | 96 | 157 | 157 |
| 2 | 96 | 148 | 115 |
| 3 | 96 | 156 | 99 |
| 4 | 96 | 148 | 115 |
| 4 | 103 | 133 | 111 |
| Triglyceride mg % 4 Wk.| 293 | 203 | 169 |
### Key Observations
* Cholesterol levels at 0 weeks are consistently higher in groups #2 and #3 compared to group #1.
* Triglyceride levels at 4 weeks are highest in group #1 and lowest in group #3.
### Interpretation
The data suggests that dietary glycan may have an effect on both cholesterol and triglyceride levels in rats. Group #1, which continued on the basal diet, had lower initial cholesterol levels but higher triglyceride levels at 4 weeks. Groups #2 and #3, which received different diets, showed elevated cholesterol levels at the start, with group #3 showing the lowest triglyceride levels at 4 weeks. This could indicate that the dietary modifications in groups #2 and #3 influenced lipid metabolism differently. Further analysis and more detailed experimental information would be needed to draw definitive conclusions.