## Time Series Diagram: A Frame
### Overview
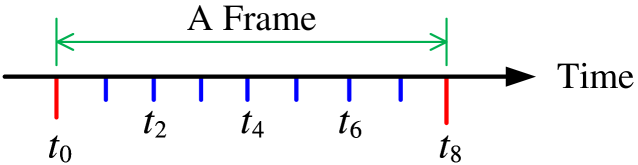
The image is a time series diagram illustrating the concept of "A Frame" within a sequence of events. It shows a timeline with events marked at different time points, with a specific duration highlighted as "A Frame".
### Components/Axes
* **Horizontal Axis:** Represents "Time", indicated by an arrow pointing to the right.
* **Time Markers:** Vertical lines indicating specific time points labeled as t0, t2, t4, t6, and t8.
* **Frame Indicator:** A green double-headed arrow above the timeline, spanning from t0 to t8, labeled "A Frame".
* **Event Markers:** Vertical lines at specific time points. t0 and t8 are marked in red, while t2, t4, and t6 are marked in blue.
### Detailed Analysis
* **Timeline:** A black horizontal line representing the progression of time.
* **Time Points:**
* t0: A red vertical line marking the start of "A Frame".
* t2: A blue vertical line marking an event.
* t4: A blue vertical line marking an event.
* t6: A blue vertical line marking an event.
* t8: A red vertical line marking the end of "A Frame".
* **"A Frame":** A green double-headed arrow spans from t0 to t8, indicating the duration of "A Frame".
### Key Observations
* "A Frame" encompasses the time period from t0 to t8.
* Events occur at t2, t4, and t6 within "A Frame".
* The start and end of "A Frame" are marked by red lines, while intermediate events are marked by blue lines.
### Interpretation
The diagram illustrates a time-based sequence where "A Frame" represents a specific interval. The events at t2, t4, and t6 occur within this frame. The red markers at t0 and t8 likely signify the boundaries or key events defining "A Frame". The diagram suggests that "A Frame" is a defined period within a larger timeline, and events within this frame are of particular interest.