# Technical Document Extraction: Time-Series Frame Diagram
## 1. Image Overview
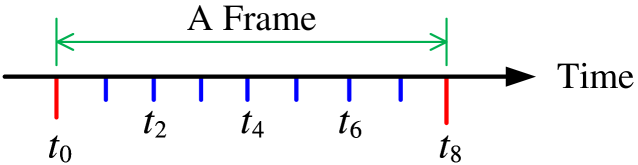
This image is a technical diagram illustrating the concept of a "Frame" within a temporal sequence. It uses a horizontal timeline with specific markers to define the boundaries and internal subdivisions of a single frame.
## 2. Component Isolation
### Header / Top Annotation
- **Label:** "A Frame"
- **Visual Indicator:** A green horizontal double-headed arrow.
- **Spatial Grounding:** The arrow spans the distance between the first vertical marker ($t_0$) and the last vertical marker ($t_8$).
- **Function:** Defines the total duration of one frame.
### Main Axis (Timeline)
- **Axis Type:** Horizontal line with a right-pointing arrowhead.
- **Axis Label:** "Time" (located at the far right of the axis).
- **Markers:** There are 9 vertical tick marks intersecting the horizontal axis.
### Tick Marks and Labels
The diagram uses color-coding and subscripts to differentiate between frame boundaries and internal time steps.
| Marker Position | Color | Label | Description |
| :--- | :--- | :--- | :--- |
| 1st Tick | Red | $t_0$ | Start boundary of the frame. |
| 2nd Tick | Blue | (None) | Internal time step ($t_1$ implied). |
| 3rd Tick | Blue | $t_2$ | Internal time step. |
| 4th Tick | Blue | (None) | Internal time step ($t_3$ implied). |
| 5th Tick | Blue | $t_4$ | Internal time step (Mid-point). |
| 6th Tick | Blue | (None) | Internal time step ($t_5$ implied). |
| 7th Tick | Blue | $t_6$ | Internal time step. |
| 8th Tick | Blue | (None) | Internal time step ($t_7$ implied). |
| 9th Tick | Red | $t_8$ | End boundary of the frame. |
## 3. Technical Analysis and Flow
- **Frame Composition:** A single "Frame" is composed of 8 equal temporal intervals.
- **Boundary Markers:** Red markers signify the start ($t_0$) and end ($t_8$) of the frame. These align with the vertical green lines of the "A Frame" span indicator.
- **Sub-intervals:** The frame is divided by blue markers. While only even-numbered subscripts ($t_2, t_4, t_6$) are explicitly labeled for the blue markers, the visual spacing indicates a linear progression of 8 units ($t_0$ through $t_8$).
- **Trend/Logic Check:** The timeline progresses linearly from left to right. The distance between each tick mark (red or blue) is uniform, suggesting a constant sampling rate or time delta ($\Delta t$) between each point.
## 4. Textual Transcription
- **Primary Text:** "A Frame"
- **Axis Label:** "Time"
- **Subscript Notations:** $t_0, t_2, t_4, t_6, t_8$