## Line Chart: Reward margin between preferred and undesirable outputs
### Overview
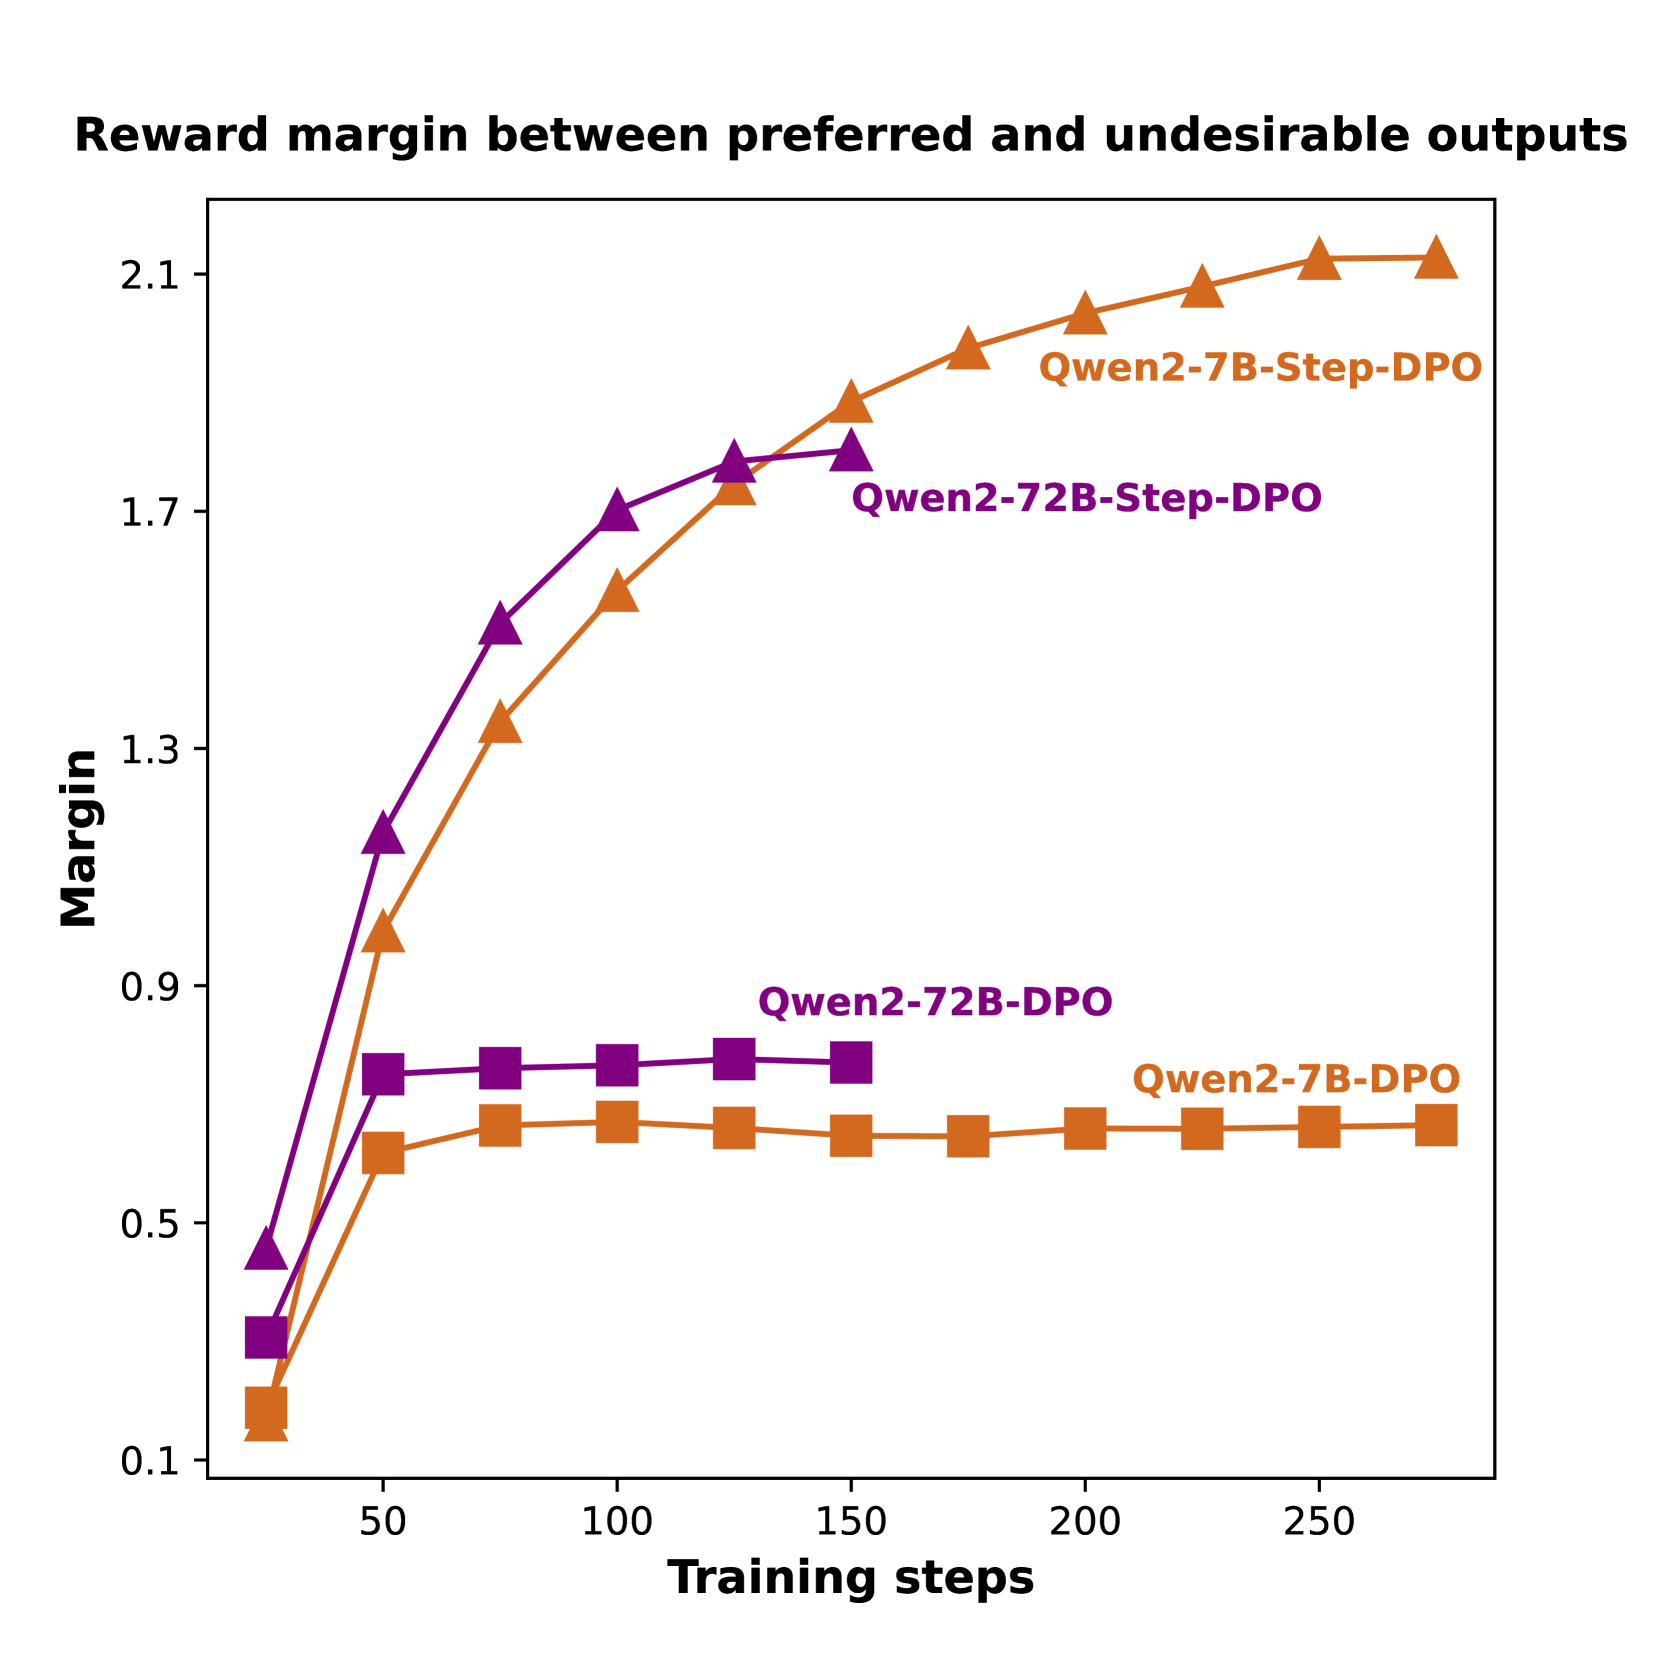
The image is a line chart comparing the reward margin between preferred and undesirable outputs for different models (Qwen2-7B-Step-DPO, Qwen2-72B-Step-DPO, Qwen2-7B-DPO, and Qwen2-72B-DPO) over training steps. The chart displays the margin on the y-axis and training steps on the x-axis.
### Components/Axes
* **Title:** Reward margin between preferred and undesirable outputs
* **X-axis:** Training steps
* Scale: 0 to 250, with markers at 50, 100, 150, 200, and 250.
* **Y-axis:** Margin
* Scale: 0.1 to 2.1, with markers at 0.1, 0.5, 0.9, 1.3, 1.7, and 2.1.
* **Legend:**
* Qwen2-7B-Step-DPO (Orange, Triangle Marker)
* Qwen2-72B-Step-DPO (Purple, Triangle Marker)
* Qwen2-7B-DPO (Orange, Square Marker)
* Qwen2-72B-DPO (Purple, Square Marker)
### Detailed Analysis
* **Qwen2-7B-Step-DPO (Orange, Triangle Marker):**
* Trend: Initially increases rapidly, then plateaus at a high margin.
* Data Points:
* At 20 training steps, margin is approximately 0.2.
* At 50 training steps, margin is approximately 0.7.
* At 100 training steps, margin is approximately 1.4.
* At 150 training steps, margin is approximately 1.9.
* At 200 training steps, margin is approximately 2.0.
* At 250 training steps, margin is approximately 2.1.
* **Qwen2-72B-Step-DPO (Purple, Triangle Marker):**
* Trend: Initially increases rapidly, then plateaus at a high margin.
* Data Points:
* At 20 training steps, margin is approximately 0.3.
* At 50 training steps, margin is approximately 1.1.
* At 100 training steps, margin is approximately 1.6.
* At 150 training steps, margin is approximately 1.8.
* At 200 training steps, margin is approximately 1.8.
* At 250 training steps, margin is approximately 2.0.
* **Qwen2-7B-DPO (Orange, Square Marker):**
* Trend: Starts low, increases slightly, then plateaus at a low margin.
* Data Points:
* At 20 training steps, margin is approximately 0.1.
* At 50 training steps, margin is approximately 0.6.
* At 100 training steps, margin is approximately 0.7.
* At 150 training steps, margin is approximately 0.7.
* At 200 training steps, margin is approximately 0.7.
* At 250 training steps, margin is approximately 0.7.
* **Qwen2-72B-DPO (Purple, Square Marker):**
* Trend: Starts low, increases slightly, then plateaus at a low margin.
* Data Points:
* At 20 training steps, margin is approximately 0.4.
* At 50 training steps, margin is approximately 0.8.
* At 100 training steps, margin is approximately 0.8.
* At 150 training steps, margin is approximately 0.8.
* At 200 training steps, margin is approximately 0.8.
* At 250 training steps, margin is approximately 0.8.
### Key Observations
* The "Step-DPO" models (Qwen2-7B-Step-DPO and Qwen2-72B-Step-DPO) achieve significantly higher reward margins than the "DPO" models (Qwen2-7B-DPO and Qwen2-72B-DPO).
* The reward margins for the "Step-DPO" models increase rapidly in the initial training steps and then plateau.
* The reward margins for the "DPO" models increase slightly and then plateau at a much lower level.
* The 72B models have a slightly higher margin than the 7B models.
### Interpretation
The data suggests that the "Step-DPO" training method is more effective at maximizing the reward margin between preferred and undesirable outputs compared to the "DPO" method. This could indicate that the "Step-DPO" method is better at learning to distinguish between desirable and undesirable outputs, leading to a higher margin. The plateauing of the reward margins suggests that the models may have reached a point of diminishing returns with the given training data and architecture. The 72B models have a slightly higher margin, suggesting that larger models may perform better.