## Box Plot: Accuracy Comparison Across Datasets
### Overview
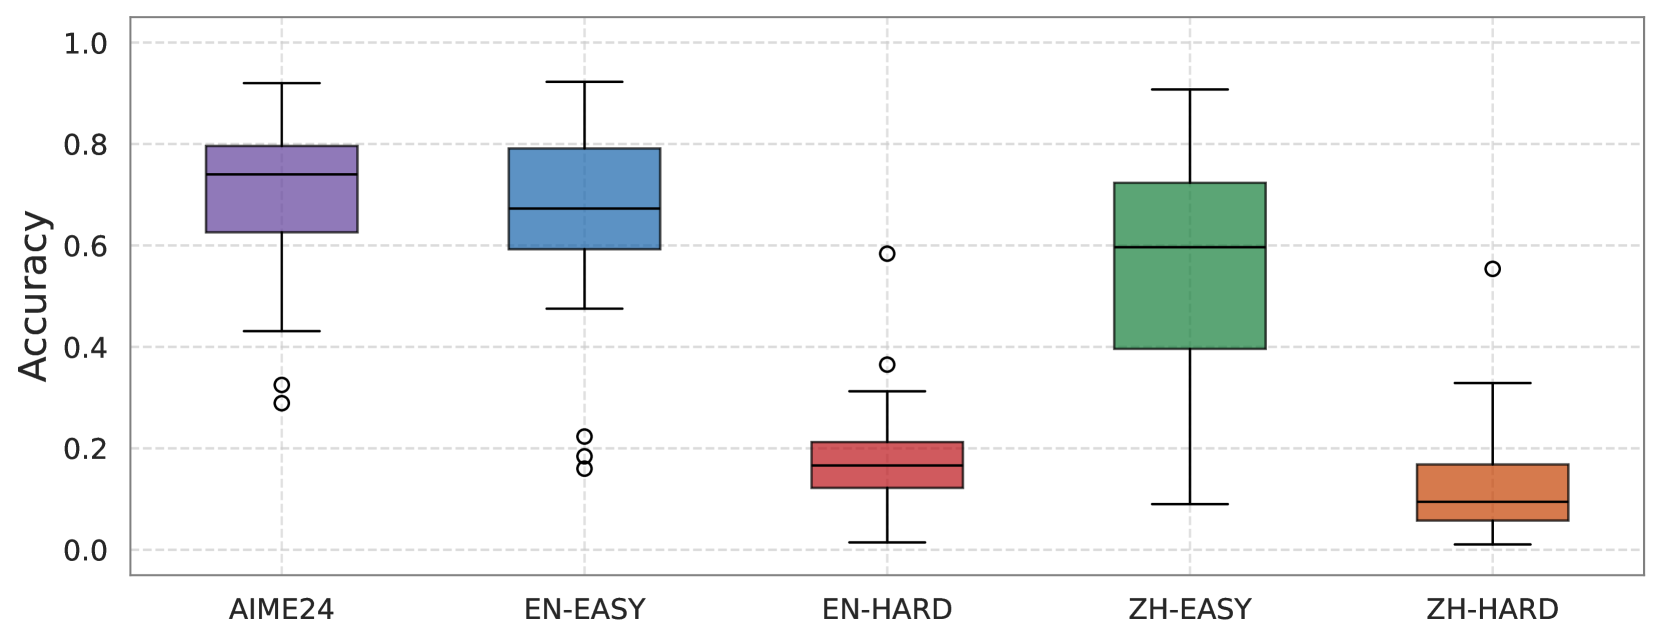
The image is a box plot comparing the accuracy of a model across five different datasets: AIME24, EN-EASY, EN-HARD, ZH-EASY, and ZH-HARD. The y-axis represents accuracy, ranging from 0.0 to 1.0. The box plot visually represents the distribution of accuracy for each dataset, showing the median, quartiles, and outliers.
### Components/Axes
* **X-axis:** Datasets (AIME24, EN-EASY, EN-HARD, ZH-EASY, ZH-HARD)
* **Y-axis:** Accuracy, ranging from 0.0 to 1.0 with increments of 0.2.
* 0.0
* 0.2
* 0.4
* 0.6
* 0.8
* 1.0
* **Box Plot Components:** Each box plot shows the median (horizontal line within the box), the first and third quartiles (edges of the box), and the whiskers extending to the furthest data point within 1.5 times the interquartile range. Outliers are plotted as individual points.
* **Colors:**
* AIME24: Purple
* EN-EASY: Blue
* EN-HARD: Red
* ZH-EASY: Green
* ZH-HARD: Orange
### Detailed Analysis
* **AIME24 (Purple):**
* Median accuracy: ~0.75
* Box extends from ~0.65 to ~0.80
* Whiskers extend from ~0.43 to ~0.92
* Outliers present below the lower whisker, around ~0.30
* Trend: Relatively high and consistent accuracy with some low outliers.
* **EN-EASY (Blue):**
* Median accuracy: ~0.68
* Box extends from ~0.60 to ~0.77
* Whiskers extend from ~0.48 to ~0.92
* Outliers present below the lower whisker, around ~0.18 and ~0.22
* Trend: High accuracy with some low outliers.
* **EN-HARD (Red):**
* Median accuracy: ~0.18
* Box extends from ~0.15 to ~0.22
* Whiskers extend from ~0.02 to ~0.32
* Outlier present above the upper whisker, around ~0.58
* Trend: Low accuracy with one high outlier.
* **ZH-EASY (Green):**
* Median accuracy: ~0.62
* Box extends from ~0.40 to ~0.72
* Whiskers extend from ~0.08 to ~0.90
* Outliers present above the upper whisker, around ~0.90
* Trend: Wide range of accuracy, with a median around 0.62.
* **ZH-HARD (Orange):**
* Median accuracy: ~0.10
* Box extends from ~0.06 to ~0.17
* Whiskers extend from ~0.0 to ~0.33
* Outlier present above the upper whisker, around ~0.55
* Trend: Low accuracy with one high outlier.
### Key Observations
* AIME24 and EN-EASY datasets show the highest median accuracy.
* EN-HARD and ZH-HARD datasets show the lowest median accuracy.
* ZH-EASY has a wider interquartile range compared to other datasets, indicating more variability in accuracy.
* Outliers are present in all datasets, indicating instances where the model performed significantly better or worse than usual.
### Interpretation
The box plot provides a comparative view of the model's performance across different datasets. The "EASY" datasets (EN-EASY and ZH-EASY) generally show higher accuracy than the "HARD" datasets (EN-HARD and ZH-HARD), which is expected. AIME24 shows the highest overall accuracy. The presence of outliers suggests that the model's performance is not always consistent and can be influenced by specific instances within each dataset. The wider interquartile range for ZH-EASY indicates that the model's performance on this dataset is more variable compared to the others.