\n
## Box Plot: Accuracy Comparison Across Language Models and Difficulty Levels
### Overview
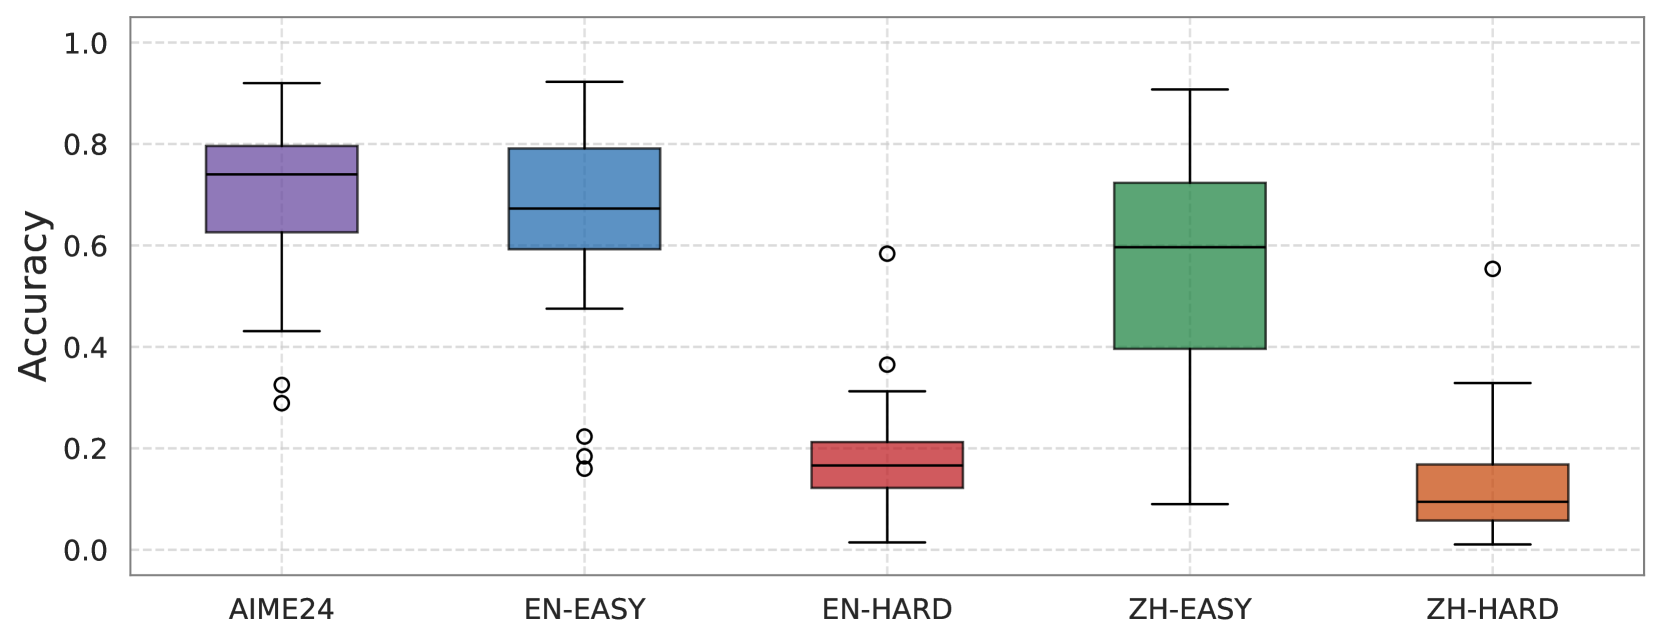
The image presents a series of box plots comparing the accuracy of different language models (AIME24, EN-EASY, EN-HARD, ZH-EASY, ZH-HARD) across varying difficulty levels. The y-axis represents accuracy, ranging from 0.0 to 1.0. The x-axis labels the different language model/difficulty combinations.
### Components/Axes
* **Y-axis:** "Accuracy" (Scale: 0.0 to 1.0, with increments of 0.2)
* **X-axis:** Categories: "AIME24", "EN-EASY", "EN-HARD", "ZH-EASY", "ZH-HARD"
* **Box Plots:** Each box plot represents the distribution of accuracy scores for a specific language model and difficulty level.
* **Outliers:** Individual data points outside the whiskers of the box plots are marked as circles ("o").
### Detailed Analysis
Here's a breakdown of each box plot, including approximate values based on visual inspection:
1. **AIME24 (Purple):**
* Median: Approximately 0.78
* Lower Quartile (Q1): Approximately 0.70
* Upper Quartile (Q3): Approximately 0.85
* Whiskers: Extend to approximately 0.35 (lower) and 0.95 (upper).
* Outlier: One outlier at approximately 0.32.
2. **EN-EASY (Blue):**
* Median: Approximately 0.74
* Lower Quartile (Q1): Approximately 0.62
* Upper Quartile (Q3): Approximately 0.83
* Whiskers: Extend to approximately 0.50 (lower) and 0.95 (upper).
* Outliers: Two outliers at approximately 0.18 and 0.52.
3. **EN-HARD (Red):**
* Median: Approximately 0.12
* Lower Quartile (Q1): Approximately 0.05
* Upper Quartile (Q3): Approximately 0.25
* Whiskers: Extend to approximately 0.00 (lower) and 0.35 (upper).
* Outlier: One outlier at approximately 0.30.
4. **ZH-EASY (Green):**
* Median: Approximately 0.70
* Lower Quartile (Q1): Approximately 0.60
* Upper Quartile (Q3): Approximately 0.80
* Whiskers: Extend to approximately 0.45 (lower) and 0.95 (upper).
5. **ZH-HARD (Orange):**
* Median: Approximately 0.16
* Lower Quartile (Q1): Approximately 0.08
* Upper Quartile (Q3): Approximately 0.25
* Whiskers: Extend to approximately 0.00 (lower) and 0.35 (upper).
* Outlier: One outlier at approximately 0.55.
### Key Observations
* **Difficulty Impact:** Accuracy generally decreases significantly when moving from "EASY" to "HARD" difficulty levels for both English (EN) and Chinese (ZH) models.
* **Model Performance:** AIME24 exhibits the highest median accuracy, followed by EN-EASY and ZH-EASY. EN-HARD and ZH-HARD show substantially lower accuracy.
* **Spread of Data:** The interquartile range (IQR) is relatively narrow for AIME24, suggesting more consistent performance. EN-HARD and ZH-HARD have wider IQRs, indicating greater variability in accuracy.
* **Outliers:** The presence of outliers suggests some data points deviate significantly from the typical performance of each model/difficulty combination.
### Interpretation
The data suggests that the AIME24 model performs best overall, achieving high accuracy across the tested difficulty levels. The English and Chinese "EASY" models demonstrate reasonable accuracy, while the "HARD" versions of both models struggle significantly. This indicates that the difficulty level is a major factor influencing performance. The wider spread of data for the "HARD" models suggests that these tasks are more challenging and lead to more variable results. The outliers may represent particularly difficult or ambiguous cases that the models failed to handle correctly.
The comparison between English and Chinese models reveals that, at the "EASY" level, their performance is comparable. However, the substantial drop in accuracy for both "HARD" versions suggests that the models may have limitations in handling complex linguistic structures or nuanced meanings in both languages. Further investigation could explore the specific types of errors made by each model to identify areas for improvement.