# Technical Data Extraction: Control Effect Analysis (Layer 16)
This document provides a comprehensive extraction of data from a technical visualization consisting of eight line charts and one summary heatmap. The data explores the "Control effect (d)" across various "Target axes" and "Affected axes" within a neural network context (Layer 16).
---
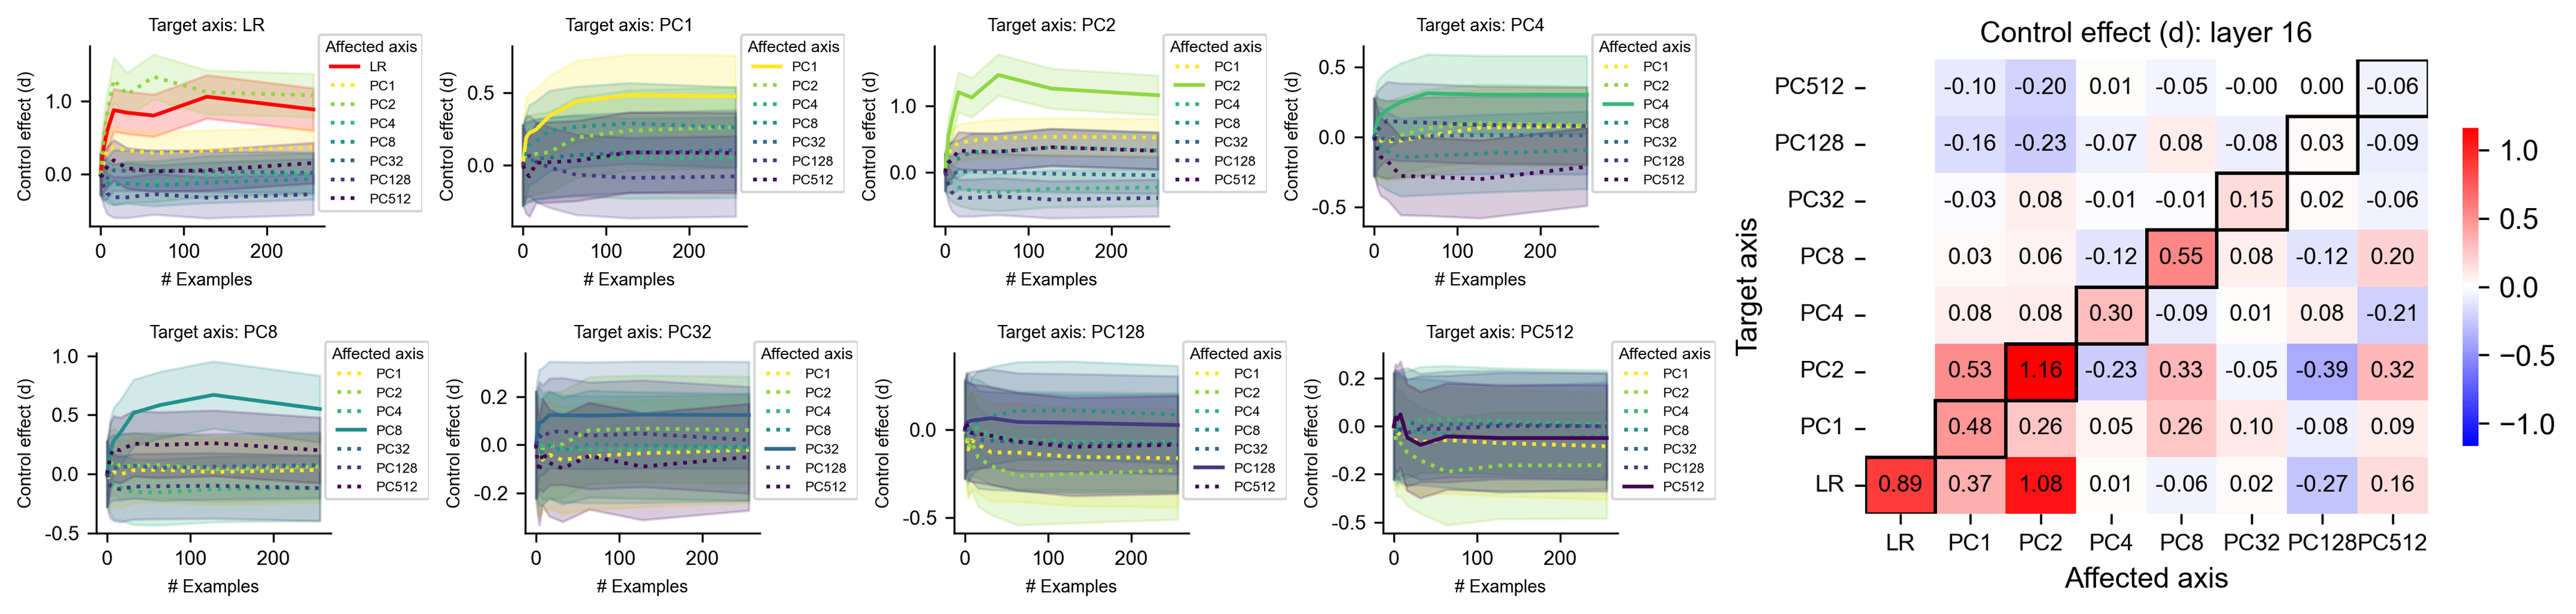
## 1. Summary Heatmap: Control effect (d): layer 16
The heatmap on the right summarizes the relationship between the **Target axis** (y-axis) and the **Affected axis** (x-axis).
### Metadata
- **Title:** Control effect (d): layer 16
- **Y-Axis Label:** Target axis
- **X-Axis Label:** Affected axis
- **Color Scale:** Diverging (Blue to White to Red).
- **Red (Positive):** Up to 1.0+ (Maximum observed: 1.16)
- **White:** 0.0
- **Blue (Negative):** Down to -1.0 (Minimum observed: -0.39)
- **Special Formatting:** Diagonal cells (where Target = Affected) are outlined with a thick black border.
### Data Table (Extracted Values)
| Target \ Affected | LR | PC1 | PC2 | PC4 | PC8 | PC32 | PC128 | PC512 |
| :--- | :---: | :---: | :---: | :---: | :---: | :---: | :---: | :---: |
| **PC512** | -0.10 | -0.20 | 0.01 | -0.05 | -0.00 | 0.00 | -0.06 | **-0.06** |
| **PC128** | -0.16 | -0.23 | -0.07 | 0.08 | -0.08 | 0.03 | **-0.09** | -0.09 |
| **PC32** | -0.03 | 0.08 | -0.01 | -0.01 | 0.15 | **0.02** | -0.06 | -0.06 |
| **PC8** | 0.03 | 0.06 | -0.12 | 0.55 | **0.08** | -0.12 | 0.20 | 0.20 |
| **PC4** | 0.08 | 0.08 | 0.30 | **-0.09** | 0.01 | 0.08 | -0.21 | -0.21 |
| **PC2** | 0.53 | 1.16 | **-0.23** | 0.33 | -0.05 | -0.39 | 0.32 | 0.32 |
| **PC1** | 0.48 | **0.26** | 0.05 | 0.26 | 0.10 | -0.08 | 0.09 | 0.09 |
| **LR** | **0.89** | 0.37 | 1.08 | 0.01 | -0.06 | 0.02 | -0.27 | 0.16 |
---
## 2. Line Charts: Control Effect vs. # Examples
Eight subplots show the progression of the control effect as the number of examples increases (0 to 250).
### Common Features
- **X-axis:** # Examples (Scale: 0, 100, 200)
- **Y-axis:** Control effect (d)
- **Legend:** "Affected axis" (Colors/Styles remain consistent across all plots).
- **Visual Trend Logic:** In most plots, the line corresponding to the "Target axis" (the self-effect) or highly correlated PCs shows the highest magnitude, typically stabilizing after 50-100 examples.
### Legend Key (Spatial Grounding: Top Right of each subplot)
- **LR:** Solid Red line
- **PC1:** Dotted Yellow line
- **PC2:** Solid Light Green line
- **PC4:** Dotted Teal line
- **PC8:** Solid Dark Teal line
- **PC32:** Dotted Blue line
- **PC128:** Solid Navy line
- **PC512:** Dotted Purple line
### Subplot Data Extraction
| Subplot (Target) | Primary Trend Description | Key Observations |
| :--- | :--- | :--- |
| **Target: LR** | Red line (LR) rises sharply and plateaus near 1.0. | PC2 (Light Green) also shows a strong positive trend (~1.0). PC1 (Yellow) is moderate (~0.4). |
| **Target: PC1** | Light Green (PC2) and Yellow (PC1) lines rise to ~0.5. | Most other lines cluster near 0.0. |
| **Target: PC2** | Light Green (PC2) rises sharply to ~1.2. | This is the highest magnitude observed in the line charts. |
| **Target: PC4** | Teal (PC4) and Light Green (PC2) rise to ~0.3. | High variance (shaded areas) is visible. |
| **Target: PC8** | Dark Teal (PC8) rises to ~0.5. | PC4 (Teal) and PC512 (Purple) show moderate positive trends. |
| **Target: PC32** | All lines cluster tightly between -0.2 and 0.2. | Blue (PC32) is slightly positive but nearly flat. |
| **Target: PC128** | Navy (PC128) and Blue (PC32) are slightly positive. | Most lines are near zero; high overlap in shaded regions. |
| **Target: PC512** | Purple (PC512) and Navy (PC128) show slight negative trends. | Values are very low magnitude (between 0.0 and -0.2). |
---
## 3. Component Analysis
1. **Header/Titles:** Each subplot is clearly labeled with "Target axis: [Name]". The main heatmap is titled "Control effect (d): layer 16".
2. **Main Charts:** The line charts use shaded regions to represent confidence intervals or variance. The heatmap uses a grid with numerical annotations.
3. **Data Consistency:** The values in the heatmap (e.g., Target LR, Affected PC2 = 1.08) match the visual plateaus in the line charts (e.g., in the "Target axis: LR" plot, the PC2 light green line plateaus just above 1.0).