## Diagram: Overlapping Regions
### Overview
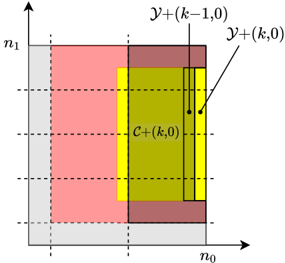
The image is a diagram illustrating overlapping regions in a two-dimensional space, likely representing sets or areas of interest. The diagram uses different colors to distinguish the regions and includes labels to identify them. The axes are labeled as n0 and n1.
### Components/Axes
* **Axes:**
* Horizontal axis: n0
* Vertical axis: n1
* **Regions:**
* Gray region: Located in the bottom-left corner, partially covered by the red region.
* Red region: Overlaps the gray region and extends further towards the top-right.
* Yellow region: Located within the red region, towards the right side.
* Olive region: Overlaps the red and yellow regions, located on the right side.
* **Labels:**
* "y+(k-1,0)": Points to the top edge of the olive region.
* "C+(k,0)": Located within the yellow region.
* "y+(k,0)": Points to the right edge of the olive region.
### Detailed Analysis or ### Content Details
The diagram shows a series of nested and overlapping regions. The gray region is the base, with the red region overlapping it. The yellow region is contained within the red region, and the olive region overlaps both the red and yellow regions. The labels indicate that these regions are likely related to some parameter 'k'.
### Key Observations
* The regions are not perfectly aligned, indicating some degree of variation or change.
* The olive region is the smallest and most specific, located at the intersection of the red and yellow regions.
### Interpretation
The diagram likely represents a concept related to set theory, spatial analysis, or some other field where overlapping regions are used to represent relationships between different entities. The parameter 'k' suggests that this is part of a series or sequence of regions. The overlapping nature of the regions indicates that there are shared characteristics or properties between them. The diagram could be used to illustrate how a particular region (e.g., the olive region) is defined by the intersection of other regions.