## Chart: KNN vs SVM Prediction Over Time
### Overview
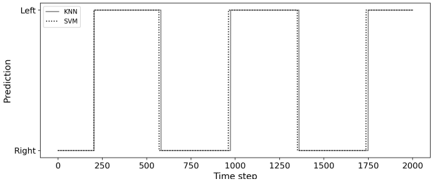
The image is a line chart comparing the predictions of two machine learning models, KNN (K-Nearest Neighbors) and SVM (Support Vector Machine), over a series of time steps. The chart shows how the predictions of these models alternate between two states, labeled "Left" and "Right".
### Components/Axes
* **X-axis:** "Time step", ranging from 0 to 2000 in increments of 250.
* **Y-axis:** "Prediction", with two categorical values: "Left" at the top and "Right" at the bottom.
* **Legend:** Located in the top-left corner.
* "KNN": Represented by a solid black line.
* "SVM": Represented by a dotted black line.
### Detailed Analysis
* **KNN:** The solid black line alternates between the "Left" and "Right" prediction states.
* It starts at "Right" from time step 0 to approximately 250.
* It switches to "Left" at approximately 250 and remains there until approximately 750.
* It switches back to "Right" at approximately 750 and remains there until approximately 1250.
* It switches to "Left" at approximately 1250 and remains there until approximately 1750.
* It switches back to "Right" at approximately 1750 and remains there until 2000.
* **SVM:** The dotted black line mirrors the behavior of the KNN line, indicating identical predictions at each time step.
* It starts at "Right" from time step 0 to approximately 250.
* It switches to "Left" at approximately 250 and remains there until approximately 750.
* It switches back to "Right" at approximately 750 and remains there until approximately 1250.
* It switches to "Left" at approximately 1250 and remains there until approximately 1750.
* It switches back to "Right" at approximately 1750 and remains there until 2000.
### Key Observations
* The KNN and SVM models produce identical predictions throughout the entire time series.
* The predictions alternate between "Left" and "Right" states in a periodic manner.
* The duration of each state ("Left" or "Right") is approximately 500 time steps.
### Interpretation
The chart demonstrates that, for this particular dataset and task, the KNN and SVM models are in complete agreement on their predictions. The periodic switching between "Left" and "Right" suggests a cyclical pattern in the underlying data that both models are able to capture effectively. The consistent agreement between the models could indicate that the decision boundary between the "Left" and "Right" classes is relatively simple and easily learned by both algorithms. It could also suggest that the models were trained on the same dataset and hyperparameters, leading to similar performance.