\n
## Line Chart: Prediction over Time
### Overview
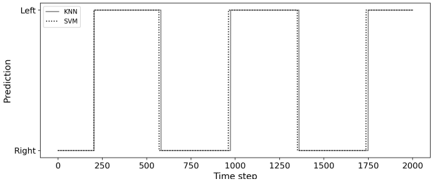
The image presents a line chart illustrating the predictions of two machine learning models, KNN and SVM, over time. The chart displays a binary prediction ("Left" or "Right") as a function of "Time step". The chart appears to show a cyclical pattern of predictions.
### Components/Axes
* **X-axis:** "Time step", ranging from approximately 0 to 2000.
* **Y-axis:** "Prediction", with two categories: "Left" and "Right". The Y-axis is not numerically scaled, but represents a categorical variable.
* **Legend:** Located in the top-left corner.
* "KNN" - represented by a solid line.
* "SVM" - represented by a dotted line.
### Detailed Analysis
The chart shows alternating predictions between "Left" and "Right" for both KNN and SVM models.
* **KNN (Solid Line):**
* From Time step 0 to approximately 250, the prediction is "Right".
* From approximately 250 to 750, the prediction is "Left".
* From approximately 750 to 1000, the prediction is "Right".
* From approximately 1000 to 1250, the prediction is "Left".
* From approximately 1250 to 1500, the prediction is "Right".
* From approximately 1500 to 1750, the prediction is "Left".
* From approximately 1750 to 2000, the prediction is "Right".
* **SVM (Dotted Line):**
* From Time step 0 to approximately 250, the prediction is "Right".
* From approximately 250 to 750, the prediction is "Left".
* From approximately 750 to 1000, the prediction is "Right".
* From approximately 1000 to 1250, the prediction is "Left".
* From approximately 1250 to 1500, the prediction is "Right".
* From approximately 1500 to 1750, the prediction is "Left".
* From approximately 1750 to 2000, the prediction is "Right".
Both models exhibit identical prediction patterns throughout the entire time step range. The predictions alternate between "Left" and "Right" approximately every 250 time steps.
### Key Observations
* Both KNN and SVM models produce the exact same predictions at every time step.
* The predictions are cyclical, alternating between "Left" and "Right" with a consistent period.
* There are no apparent discrepancies or variations in the predictions between the two models.
### Interpretation
The chart suggests that both the KNN and SVM models are performing identically on this particular dataset or task. The consistent, cyclical pattern of predictions indicates that the underlying data may have a periodic or alternating characteristic. The fact that both models agree perfectly could imply that the task is relatively simple, or that the models have converged to the same solution. It's also possible that the data is intentionally designed to produce this alternating pattern, perhaps for testing or demonstration purposes. Further investigation into the data and the specific task would be needed to understand the underlying reasons for this behavior. The lack of variation between the models doesn't necessarily indicate superiority of one over the other; it simply means they are both equally capable of capturing the pattern present in the data.