## Line Graph: Prediction Behavior of KNN and SVM Models Over Time
### Overview
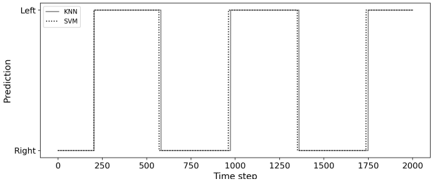
The image is a line graph comparing the prediction behavior of two machine learning models (KNN and SVM) across 2000 time steps. The y-axis represents binary prediction categories ("Left" and "Right"), while the x-axis represents sequential time steps. Two distinct data series are plotted: a solid line for KNN and a dotted line for SVM.
### Components/Axes
- **X-axis (Horizontal)**:
- Label: "Time step"
- Scale: 0 to 2000 in increments of 250
- Position: Bottom of the graph
- **Y-axis (Vertical)**:
- Label: "Prediction"
- Categories: "Left" (bottom) and "Right" (top)
- Position: Left side of the graph
- **Legend**:
- Position: Top-left corner
- Entries:
- Solid line: "KNN"
- Dotted line: "SVM"
### Detailed Analysis
1. **KNN Model (Solid Line)**:
- **Initial State**: Predicts "Left" from time step 0 to ~250.
- **First Switch**: Transitions to "Right" at ~250, maintaining this prediction until ~750.
- **Second Switch**: Returns to "Left" at ~750, lasting until ~1250.
- **Third Switch**: Shifts to "Right" at ~1250, persisting until ~1750.
- **Final State**: Reverts to "Left" at ~1750, ending at time step 2000.
- **Key Pattern**: Alternates predictions every ~500 time steps, with the final prediction being "Left".
2. **SVM Model (Dotted Line)**:
- **Initial State**: Predicts "Left" from time step 0 to ~500.
- **First Switch**: Transitions to "Right" at ~500, maintaining this until ~1000.
- **Second Switch**: Returns to "Left" at ~1000, lasting until ~1500.
- **Third Switch**: Shifts to "Right" at ~1500, continuing until time step 2000.
- **Key Pattern**: Alternates predictions every ~500 time steps, with the final prediction being "Right".
### Key Observations
- **Temporal Consistency**: Both models exhibit periodic prediction switches, but with differing frequencies and durations.
- **Final Prediction Divergence**: At time step 2000, KNN predicts "Left" while SVM predicts "Right", indicating model-specific final states.
- **Switch Timing**:
- KNN switches at ~250, 750, 1250, 1750.
- SVM switches at ~500, 1000, 1500.
- **Stability**: SVM maintains predictions for longer intervals (500 steps) compared to KNN's shorter intervals (~250–500 steps).
### Interpretation
The graph demonstrates contrasting prediction dynamics between KNN and SVM:
1. **KNN Behavior**:
- Suggests higher sensitivity to recent data, as evidenced by more frequent prediction changes.
- Final "Left" prediction at 2000 may reflect recent input patterns dominating its output.
2. **SVM Behavior**:
- Indicates greater stability, with predictions persisting for longer intervals.
- Final "Right" prediction at 2000 suggests reliance on broader temporal context rather than recent data.
3. **Practical Implications**:
- KNN might be more suitable for applications requiring rapid adaptation to new data.
- SVM could be preferable for scenarios demanding consistent, long-term predictions.
4. **Anomalies**:
- The abrupt switch at time step 1750 for KNN (from Right to Left) deviates from its earlier ~500-step intervals, potentially indicating an outlier or data shift.
### Spatial Grounding
- **Legend**: Top-left corner, clearly associating line styles with model names.
- **Y-axis Categories**: "Left" positioned at the bottom, "Right" at the top, creating a vertical binary distinction.
- **X-axis Markers**: Time steps labeled at 0, 250, 500, ..., 2000, with grid lines for reference.
### Content Details
- **Numerical Values**:
- KNN switches: ~250, 750, 1250, 1750.
- SVM switches: ~500, 1000, 1500.
- **Line Styles**: Solid (KNN) vs. Dotted (SVM) for visual differentiation.
### Conclusion
The graph highlights model-specific prediction strategies, with KNN favoring recent data and SVM emphasizing stability. These differences underscore the importance of model selection based on application requirements for temporal sensitivity versus consistency.