\n
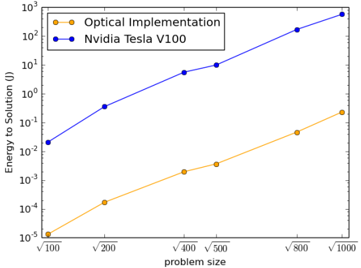
## Chart: Energy to Solution vs. Problem Size
### Overview
The image presents a chart comparing the energy consumption of two computational methods – an Optical Implementation and a Nvidia Tesla V100 – as a function of problem size. The chart uses a logarithmic y-axis to display the energy consumption, highlighting the differences in scaling between the two methods.
### Components/Axes
* **X-axis:** "problem size". The axis markers are √100, √200, √400, √500, √800, and √1000.
* **Y-axis:** "Energy to Solution (J)". The axis is logarithmic, ranging from 10<sup>-5</sup> to 10<sup>3</sup>.
* **Legend:** Located in the top-left corner.
* "Optical Implementation" – represented by orange circles with dashed lines.
* "Nvidia Tesla V100" – represented by blue circles with solid lines.
### Detailed Analysis
**Nvidia Tesla V100 (Blue Line):**
The blue line slopes upward consistently, indicating an increasing energy consumption with increasing problem size.
* At √100 (problem size = 10), the energy consumption is approximately 0.02 J (2 x 10<sup>-2</sup> J).
* At √200 (problem size ≈ 14.14), the energy consumption is approximately 0.05 J (5 x 10<sup>-2</sup> J).
* At √400 (problem size = 20), the energy consumption is approximately 0.2 J (2 x 10<sup>-1</sup> J).
* At √500 (problem size ≈ 22.36), the energy consumption is approximately 0.6 J (6 x 10<sup>-1</sup> J).
* At √800 (problem size ≈ 28.28), the energy consumption is approximately 2 J (2 x 10<sup>0</sup> J).
* At √1000 (problem size = 31.62), the energy consumption is approximately 6 J (6 x 10<sup>0</sup> J).
**Optical Implementation (Orange Line):**
The orange line also slopes upward, but at a much slower rate than the blue line.
* At √100 (problem size = 10), the energy consumption is approximately 0.00001 J (1 x 10<sup>-5</sup> J).
* At √200 (problem size ≈ 14.14), the energy consumption is approximately 0.0001 J (1 x 10<sup>-4</sup> J).
* At √400 (problem size = 20), the energy consumption is approximately 0.002 J (2 x 10<sup>-3</sup> J).
* At √500 (problem size ≈ 22.36), the energy consumption is approximately 0.003 J (3 x 10<sup>-3</sup> J).
* At √800 (problem size ≈ 28.28), the energy consumption is approximately 0.01 J (1 x 10<sup>-2</sup> J).
* At √1000 (problem size = 31.62), the energy consumption is approximately 0.03 J (3 x 10<sup>-2</sup> J).
### Key Observations
* The Nvidia Tesla V100 consumes significantly more energy than the Optical Implementation for all problem sizes.
* The energy consumption of the Nvidia Tesla V100 increases much more rapidly with problem size than the Optical Implementation.
* The logarithmic y-axis emphasizes the large difference in energy consumption between the two methods.
* The Optical Implementation exhibits a nearly linear increase in energy consumption on this log scale, suggesting a polynomial relationship.
### Interpretation
The chart demonstrates that the Optical Implementation is significantly more energy-efficient than the Nvidia Tesla V100, especially as the problem size increases. The steeper slope of the Nvidia Tesla V100 line indicates that its energy consumption scales poorly with problem size, making it less suitable for large-scale computations. The Optical Implementation, with its shallower slope, offers a more sustainable solution for larger problems. The use of a logarithmic scale is crucial for visualizing the large disparity in energy consumption, as a linear scale would make the Optical Implementation's energy usage appear negligible. This suggests that optical computing may be a promising avenue for reducing the energy footprint of computationally intensive tasks. The data suggests a power law relationship for the Nvidia Tesla V100, while the Optical Implementation appears closer to linear on the log-log scale.