## Line Graph: Modality Specialization Across Layers
### Overview
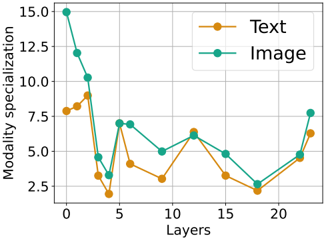
The image is a line graph comparing the modality specialization of "Text" and "Image" across 21 layers (0–20). Two lines represent the data: orange for "Text" and teal for "Image." The y-axis measures "Modality specialization" on a scale from 2.5 to 15.0, while the x-axis represents "Layers" from 0 to 20. The legend is positioned in the top-right corner.
### Components/Axes
- **X-axis (Layers)**: Labeled "Layers," with markers at 0, 5, 10, 15, and 20.
- **Y-axis (Modality specialization)**: Labeled "Modality specialization," with increments of 2.5 (2.5, 5.0, 7.5, 10.0, 12.5, 15.0).
- **Legend**: Located in the top-right corner, with orange circles labeled "Text" and teal circles labeled "Image."
- **Data Points**: Circles connected by lines for both series.
### Detailed Analysis
#### Text (Orange Line)
- **Layer 0**: ~7.5
- **Layer 3**: Peaks at ~10.0
- **Layer 4**: Drops to ~2.5
- **Layer 5**: Rises to ~7.5
- **Layer 10**: ~3.0
- **Layer 12**: ~6.5
- **Layer 15**: ~3.0
- **Layer 18**: ~2.5
- **Layer 20**: ~6.0
#### Image (Teal Line)
- **Layer 0**: Peaks at ~15.0
- **Layer 3**: ~10.0
- **Layer 4**: ~5.0
- **Layer 5**: ~7.5
- **Layer 10**: ~5.0
- **Layer 12**: ~6.5
- **Layer 15**: ~5.0
- **Layer 18**: ~3.0
- **Layer 20**: ~7.5
### Key Observations
1. **Initial Disparity**: The "Image" line starts significantly higher (~15.0 at Layer 0) compared to "Text" (~7.5 at Layer 0).
2. **Early Fluctuations**: Both lines show volatility in the first 5 layers, with "Text" experiencing a sharp drop to ~2.5 at Layer 4.
3. **Convergence**: By Layer 20, the two lines converge, with "Text" at ~6.0 and "Image" at ~7.5.
4. **Trend Reversal**: "Text" shows a general decline after Layer 3, while "Image" declines more gradually.
### Interpretation
The data suggests that "Image" modality specialization dominates in early layers (e.g., Layer 0–5), potentially reflecting a focus on visual processing in initial neural network stages. "Text" specialization lags initially but shows recovery in later layers (e.g., Layer 12–20), indicating possible compensatory mechanisms or increased textual processing in deeper layers. The fluctuations may highlight variability in how modalities are prioritized across layers, with "Text" exhibiting sharper declines in early stages. This could imply architectural differences in how text and image data are hierarchically processed.