\n
## Box Plot: PPL Score vs. Watermarking Type & Model
### Overview
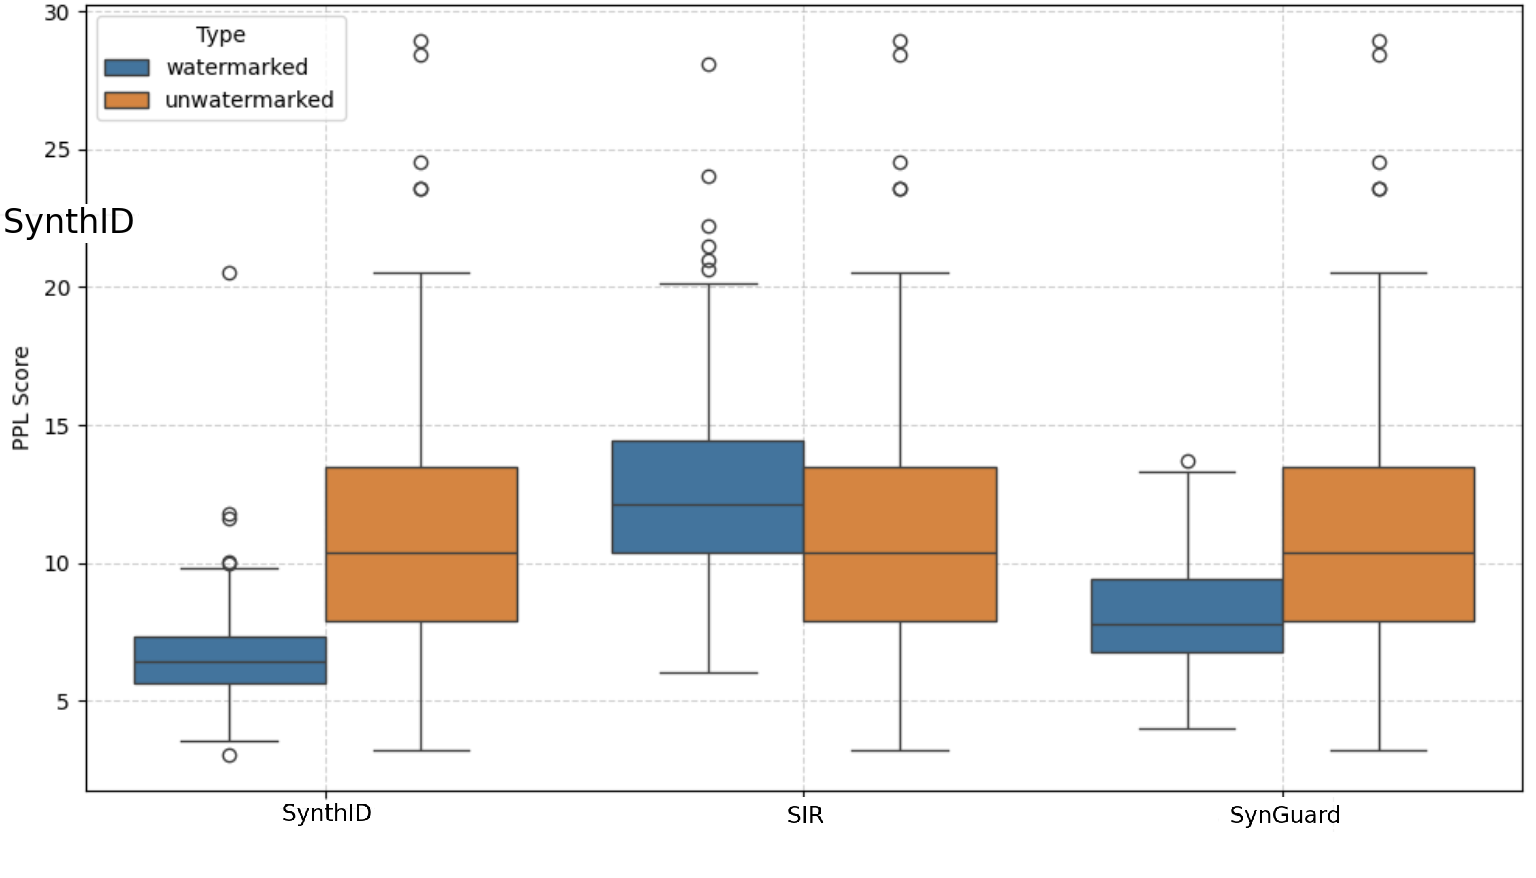
The image presents a series of box plots comparing the Perplexity (PPL) scores for watermarked and unwatermarked text generated by three different models: SynthID, SIR, and SynGuard. The PPL score is a measure of how well a probability model predicts a sample. Lower PPL scores generally indicate better performance.
### Components/Axes
* **X-axis:** Model Name (SynthID, SIR, SynGuard)
* **Y-axis:** PPL Score (Scale from approximately 4 to 30)
* **Legend:**
* **Type:** watermarked (represented by blue color)
* **Type:** unwatermarked (represented by orange color)
* **Plot Type:** Box plots with overlaid individual data points (circles).
* **Gridlines:** Horizontal gridlines are present to aid in reading values.
### Detailed Analysis
The image contains three sets of box plots, one for each model. Each set contains two box plots, one for watermarked data and one for unwatermarked data.
**SynthID:**
* **Watermarked (Blue):** The box plot spans approximately from 6 to 12. The median is around 8. There are several outliers above 20.
* **Unwatermarked (Orange):** The box plot spans approximately from 5 to 10. The median is around 7. There are outliers around 20 and 24.
**SIR:**
* **Watermarked (Blue):** The box plot spans approximately from 10 to 20. The median is around 14. There are several outliers, ranging from approximately 22 to 28.
* **Unwatermarked (Orange):** The box plot spans approximately from 8 to 18. The median is around 12. There are outliers ranging from approximately 20 to 26.
**SynGuard:**
* **Watermarked (Blue):** The box plot spans approximately from 8 to 16. The median is around 11. There are outliers around 18 and 24.
* **Unwatermarked (Orange):** The box plot spans approximately from 8 to 16. The median is around 11. There are outliers around 22 and 26.
### Key Observations
* **SIR consistently has higher PPL scores than SynthID and SynGuard**, suggesting it performs worse in terms of predicting the text.
* **Watermarking generally increases the PPL score** for all three models, indicating that the watermarking process introduces some degradation in the model's predictive ability.
* **Outliers are present in all datasets**, suggesting some generated texts are significantly different from the majority.
* **The spread of the data (as indicated by the box plot size) varies between models and watermarking types.** SIR has the largest spread, indicating the most variability in PPL scores.
### Interpretation
The data suggests that watermarking introduces a trade-off between security/traceability and model performance. While watermarking allows for the identification of generated text, it appears to slightly reduce the quality of the generated text as measured by PPL. The model SIR appears to be more sensitive to the watermarking process, exhibiting a larger increase in PPL score compared to SynthID and SynGuard. The presence of outliers in all datasets suggests that the watermarking process may not be uniformly effective, and some generated texts may be more easily detectable than others.
The differences in PPL scores between models suggest that they have varying levels of inherent predictive power. The fact that watermarking consistently increases PPL scores across all models indicates that the watermarking process introduces some level of noise or distortion to the generated text, which affects the model's ability to accurately predict the next token. Further investigation could explore the specific watermarking techniques used and their impact on the generated text's characteristics.