## Line Charts: Agreement with Bayesian Assistant Across LLMs and Interactions
### Overview
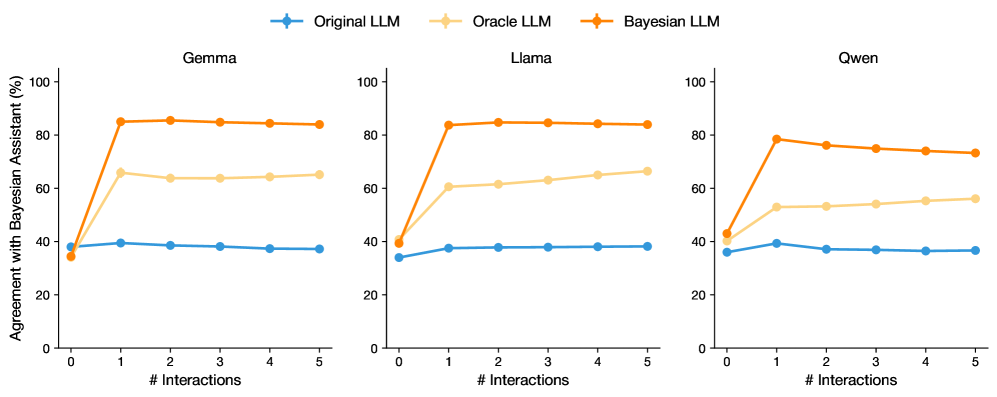
The image displays three horizontally arranged line charts, each comparing the performance of a different Large Language Model (LLM) over a series of interactions. The charts measure the "Agreement with Bayesian Assistant (%)" as a function of the number of interactions (# Interactions). Each chart contains three data series representing different model variants: Original LLM, Oracle LLM, and Bayesian LLM.
### Components/Axes
* **Chart Titles (Subplots):** Centered above each chart: "Gemma" (left), "Llama" (center), "Qwen" (right).
* **Y-Axis (All Charts):** Label: "Agreement with Bayesian Assistant (%)". Scale: 0 to 100, with major tick marks at 0, 20, 40, 60, 80, 100.
* **X-Axis (All Charts):** Label: "# Interactions". Scale: 0 to 5, with integer tick marks at 0, 1, 2, 3, 4, 5.
* **Legend:** Positioned at the top center of the entire figure, spanning all three subplots.
* **Original LLM:** Blue line with circular markers.
* **Oracle LLM:** Light orange (beige) line with circular markers.
* **Bayesian LLM:** Dark orange line with circular markers.
* **Data Series:** Each chart contains three lines corresponding to the legend, with markers at each integer interaction point (0 through 5).
### Detailed Analysis
**1. Gemma (Left Chart)**
* **Bayesian LLM (Dark Orange):** Starts at approximately 35% at 0 interactions. Shows a sharp, near-vertical increase to about 85% at 1 interaction. The line then plateaus, remaining stable at approximately 85% for interactions 2 through 5.
* **Oracle LLM (Light Orange):** Starts at approximately 35% at 0 interactions. Increases to about 65% at 1 interaction. The line then shows a very slight downward trend, ending at approximately 63% at 5 interactions.
* **Original LLM (Blue):** Starts at approximately 35% at 0 interactions. Increases slightly to about 40% at 1 interaction. The line then shows a gradual, shallow downward trend, ending at approximately 37% at 5 interactions.
**2. Llama (Center Chart)**
* **Bayesian LLM (Dark Orange):** Starts at approximately 40% at 0 interactions. Shows a sharp increase to about 83% at 1 interaction. The line then plateaus, remaining stable at approximately 84% for interactions 2 through 5.
* **Oracle LLM (Light Orange):** Starts at approximately 40% at 0 interactions. Increases to about 60% at 1 interaction. The line then shows a gradual upward trend, ending at approximately 66% at 5 interactions.
* **Original LLM (Blue):** Starts at approximately 35% at 0 interactions. Increases to about 38% at 1 interaction. The line then remains nearly flat, stable at approximately 38% for interactions 2 through 5.
**3. Qwen (Right Chart)**
* **Bayesian LLM (Dark Orange):** Starts at approximately 43% at 0 interactions. Shows a sharp increase to about 78% at 1 interaction. The line then shows a gradual downward trend, ending at approximately 73% at 5 interactions.
* **Oracle LLM (Light Orange):** Starts at approximately 43% at 0 interactions. Increases to about 53% at 1 interaction. The line then shows a gradual upward trend, ending at approximately 56% at 5 interactions.
* **Original LLM (Blue):** Starts at approximately 36% at 0 interactions. Peaks at about 39% at 1 interaction. The line then shows a gradual downward trend, ending at approximately 36% at 5 interactions.
### Key Observations
1. **Dominant Performance:** The Bayesian LLM (dark orange) consistently achieves the highest agreement percentage after the first interaction across all three base models (Gemma, Llama, Qwen).
2. **Initial Jump:** All three model variants (Original, Oracle, Bayesian) show their most significant change in agreement between 0 and 1 interaction. The Bayesian LLM's jump is the most dramatic.
3. **Post-Jump Trends:**
* The Bayesian LLM plateaus (Gemma, Llama) or slightly declines (Qwen) after interaction 1.
* The Oracle LLM shows a slight upward trend (Llama, Qwen) or a very slight decline (Gemma) after interaction 1.
* The Original LLM remains relatively flat or shows a shallow decline after interaction 1.
4. **Model Comparison:** The starting agreement (at 0 interactions) varies slightly by base model, with Qwen starting highest (~43%) and Gemma/Llama starting lower (~35-40%).
### Interpretation
The data demonstrates a clear hierarchy in performance when aligning with a Bayesian Assistant. The **Bayesian LLM** variant, which presumably incorporates Bayesian inference or updating, shows a transformative improvement after a single interaction, reaching high agreement (73-85%) and maintaining it. This suggests that the Bayesian adaptation is highly effective and efficient.
The **Oracle LLM**, which likely represents a model with access to some ground-truth or privileged information, performs better than the original but significantly worse than the Bayesian variant. Its gradual improvement in Llama and Qwen suggests it can learn slowly from interactions, but it lacks the decisive alignment capability of the Bayesian approach.
The **Original LLM** shows minimal ability to improve its agreement with the Bayesian Assistant through interaction alone, hovering near its baseline. This indicates that without specific architectural or methodological changes (like Bayesian updating), standard LLMs do not naturally converge towards the assistant's reasoning pattern through dialogue.
The slight decline in the Bayesian LLM's performance for Qwen after the first interaction is a notable anomaly. It could indicate a form of overfitting to the initial interaction or a diminishing return where subsequent interactions introduce noise rather than clarifying signal for that specific model. Overall, the charts argue strongly for the efficacy of Bayesian methods in creating AI assistants that can rapidly and stably align with a target reasoning framework.