## Line Chart: HumanEval vs. Tokens Trained
### Overview
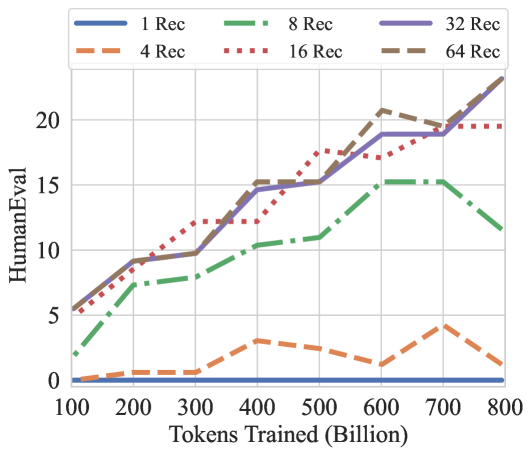
The image is a line chart comparing "HumanEval" scores against "Tokens Trained (Billion)" for different configurations denoted as "Rec" (likely referring to some kind of "recurrent" or "recognition" parameter). There are six data series, each representing a different "Rec" value: 1, 4, 8, 16, 32, and 64. The chart shows how the HumanEval score changes as the number of tokens trained increases for each configuration.
### Components/Axes
* **X-axis:** "Tokens Trained (Billion)". The scale ranges from 100 to 800, with tick marks at intervals of 100.
* **Y-axis:** "HumanEval". The scale ranges from 0 to 25, with tick marks at intervals of 5.
* **Legend:** Located at the top of the chart, it identifies each line by its "Rec" value and corresponding color/linestyle:
* **Blue:** 1 Rec (solid line)
* **Orange:** 4 Rec (dashed line)
* **Green:** 8 Rec (dash-dotted line)
* **Red:** 16 Rec (dotted line)
* **Purple:** 32 Rec (solid line)
* **Brown:** 64 Rec (dashed line)
### Detailed Analysis
* **1 Rec (Blue, Solid):** The line remains almost flat at a value of approximately 0 for all token values.
* (100, ~0)
* (800, ~0)
* **4 Rec (Orange, Dashed):** The line starts near 0, increases slightly, and then fluctuates between 1 and 4.
* (100, ~0)
* (200, ~0.5)
* (300, ~1)
* (400, ~3)
* (500, ~2)
* (600, ~1)
* (700, ~4)
* (800, ~1)
* **8 Rec (Green, Dash-Dotted):** The line increases from approximately 2 to 15, then decreases to approximately 12.
* (100, ~2)
* (200, ~7)
* (300, ~8)
* (400, ~10)
* (500, ~11)
* (600, ~15)
* (700, ~15)
* (800, ~12)
* **16 Rec (Red, Dotted):** The line increases from approximately 6 to 19, then plateaus around 19.
* (100, ~6)
* (200, ~9)
* (300, ~12)
* (400, ~15)
* (500, ~18)
* (600, ~19)
* (700, ~19)
* (800, ~19)
* **32 Rec (Purple, Solid):** The line increases from approximately 6 to 23.
* (100, ~6)
* (200, ~9)
* (300, ~13)
* (400, ~15)
* (500, ~15)
* (600, ~19)
* (700, ~19)
* (800, ~23)
* **64 Rec (Brown, Dashed):** The line increases from approximately 6 to 23.
* (100, ~6)
* (200, ~8)
* (300, ~12)
* (400, ~15)
* (500, ~15)
* (600, ~19)
* (700, ~19)
* (800, ~23)
### Key Observations
* The "1 Rec" configuration performs significantly worse than all other configurations, with HumanEval scores consistently near 0.
* The "4 Rec" configuration also performs poorly, with HumanEval scores generally below 5.
* The "8 Rec" configuration shows an initial increase in HumanEval score, but then decreases after 600 Billion tokens trained.
* The "16 Rec", "32 Rec", and "64 Rec" configurations show similar performance, with HumanEval scores increasing significantly as the number of tokens trained increases. The "16 Rec" plateaus around 19, while "32 Rec" and "64 Rec" continue to increase to approximately 23.
### Interpretation
The chart suggests that the "Rec" parameter has a significant impact on the HumanEval score. Lower values of "Rec" (1 and 4) result in poor performance, while higher values (16, 32, and 64) lead to significantly better results. The "8 Rec" configuration shows a non-monotonic relationship, suggesting that there may be an optimal value for this parameter. The plateauing of the "16 Rec" configuration suggests that there may be diminishing returns to training beyond a certain point for this configuration. The continued increase of "32 Rec" and "64 Rec" suggests that these configurations may benefit from further training.