\n
## Line Chart: HumanEval Performance vs. Training Tokens by Recitation Count
### Overview
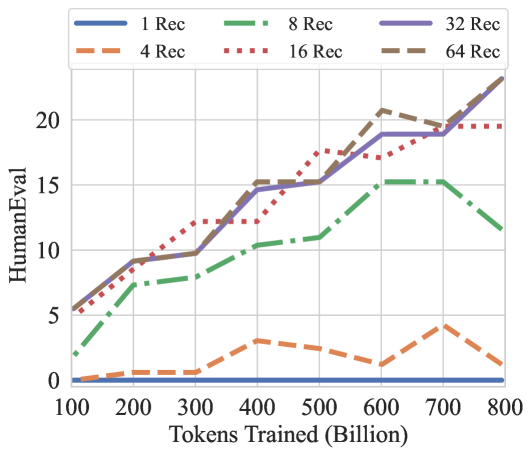
The image is a line chart plotting the performance on the HumanEval benchmark (y-axis) against the number of tokens used for training (x-axis, in billions). It compares six different experimental conditions, differentiated by the number of "Rec" (likely recitations or repetitions of training data), ranging from 1 to 64. The chart demonstrates how model performance scales with training compute and how this scaling is affected by the recitation parameter.
### Components/Axes
* **Chart Type:** Multi-series line chart.
* **X-Axis:** Label: "Tokens Trained (Billion)". Scale: Linear, from 100 to 800 in increments of 100.
* **Y-Axis:** Label: "HumanEval". Scale: Linear, from 0 to 20 in increments of 5. The maximum visible value is slightly above 20.
* **Legend:** Positioned at the top center of the chart area. It contains six entries, each with a unique color and line style:
* `1 Rec`: Solid blue line.
* `4 Rec`: Dashed orange line.
* `8 Rec`: Dash-dot green line.
* `16 Rec`: Dotted red line.
* `32 Rec`: Solid purple line.
* `64 Rec`: Dashed brown line.
### Detailed Analysis
Data points are approximate, read from the chart's grid.
**1. 1 Rec (Solid Blue Line):**
* **Trend:** Perfectly flat, horizontal line at the very bottom of the chart.
* **Data Points:** HumanEval score is 0 at all training token levels (100B to 800B).
**2. 4 Rec (Dashed Orange Line):**
* **Trend:** Very low performance with minor fluctuations. Shows a slight peak around 400B and 700B tokens.
* **Data Points (Approx.):**
* 100B: ~0
* 200B: ~0.5
* 300B: ~0.5
* 400B: ~3
* 500B: ~2.5
* 600B: ~1
* 700B: ~4
* 800B: ~1
**3. 8 Rec (Dash-Dot Green Line):**
* **Trend:** Steady, moderate upward trend until 700B, followed by a notable decline at 800B.
* **Data Points (Approx.):**
* 100B: ~2
* 200B: ~7
* 300B: ~8
* 400B: ~10.5
* 500B: ~11
* 600B: ~14.5
* 700B: ~15
* 800B: ~11.5
**4. 16 Rec (Dotted Red Line):**
* **Trend:** Strong, consistent upward trend, showing the most linear growth among the series. It plateaus slightly after 600B.
* **Data Points (Approx.):**
* 100B: ~5.5
* 200B: ~9
* 300B: ~12
* 400B: ~12
* 500B: ~17.5
* 600B: ~17
* 700B: ~19.5
* 800B: ~19.5
**5. 32 Rec (Solid Purple Line):**
* **Trend:** Strong upward trend, closely tracking the 64 Rec line until 600B, after which it continues to rise while 64 Rec dips slightly.
* **Data Points (Approx.):**
* 100B: ~5.5
* 200B: ~9
* 300B: ~9.5
* 400B: ~15
* 500B: ~15
* 600B: ~19
* 700B: ~19
* 800B: ~23
**6. 64 Rec (Dashed Brown Line):**
* **Trend:** Initially the strongest performer, showing a steep rise. It peaks at 600B, dips at 700B, and then rises again to match the 32 Rec line at 800B.
* **Data Points (Approx.):**
* 100B: ~5.5
* 200B: ~9
* 300B: ~9.5
* 400B: ~15
* 500B: ~15.5
* 600B: ~20.5
* 700B: ~19.5
* 800B: ~23
### Key Observations
1. **Clear Hierarchy:** There is a distinct performance hierarchy based on recitation count. `1 Rec` fails completely. `4 Rec` performs very poorly. `8 Rec` is in a middle tier. `16, 32, and 64 Rec` form a high-performance cluster.
2. **Diminishing Returns/Instability at High Rec:** While `64 Rec` is initially best, its performance becomes unstable after 600B tokens (dipping at 700B). By 800B, `32 Rec` and `64 Rec` converge at the highest score (~23), suggesting a potential ceiling or that the benefit of increasing recitations from 32 to 64 is minimal at this scale.
3. **The 8 Rec Anomaly:** The `8 Rec` series shows a significant performance drop at the final data point (800B), which is not observed in the higher-recitation series. This could indicate a training instability or overfitting specific to that configuration at large scale.
4. **Scaling Behavior:** For the effective configurations (16+ Rec), performance generally scales with training tokens, but the rate of improvement (slope) varies. The growth is not perfectly linear for any series, showing periods of acceleration and plateau.
### Interpretation
This chart provides strong evidence that the "recitation" hyperparameter is critical for achieving high performance on the HumanEval coding benchmark when scaling up model training.
* **The Necessity of Recitation:** The complete failure of `1 Rec` and poor performance of `4 Rec` suggest that a minimum threshold of data recitation (likely around 8 or more) is required for the model to effectively learn from the training tokens in this context. This could be related to preventing catastrophic forgetting or ensuring sufficient exposure to patterns.
* **Optimal Range:** The data suggests an optimal range for this parameter lies between 16 and 64. Within this range, performance is robust and scales well with compute. The convergence of `32 Rec` and `64 Rec` at 800B tokens indicates diminishing returns, implying that beyond a certain point (32 recitations), additional repetitions do not yield proportional benefits and may even introduce instability (as seen with `64 Rec` at 700B).
* **Practical Implication:** For practitioners, this chart argues against using low recitation counts for large-scale training runs aimed at code generation. It also suggests that `32 Rec` may be a more stable and efficient choice than `64 Rec` for very large token budgets, achieving the same peak performance with potentially lower computational overhead during training.
* **Underlying Mechanism:** The "recitation" likely controls how many times the training data is revisited. The chart implies that code generation capabilities benefit from multiple exposures to the training corpus, but the relationship is non-linear and subject to potential overfitting or optimization difficulties at the highest settings.