\n
## Grouped Bar Chart: AI Model Performance Comparison
### Overview
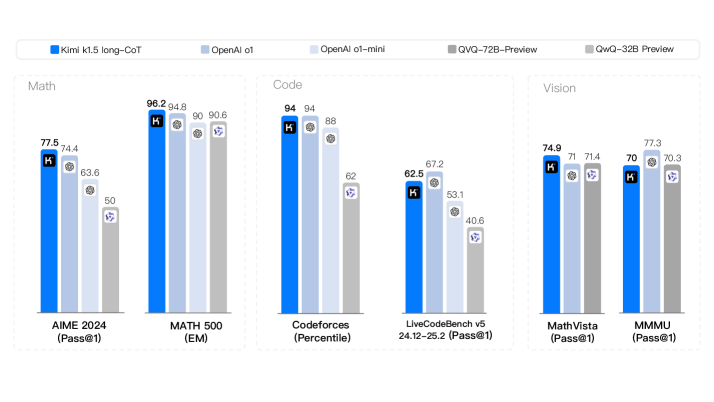
The image displays a grouped bar chart comparing the performance of five different AI models across six distinct benchmarks. The benchmarks are categorized into three domains: Math, Code, and Vision. The chart uses a consistent color scheme to represent each model, with numerical performance scores displayed atop each bar.
### Components/Axes
* **Legend (Top Center):** A horizontal legend identifies the five models by color:
* **Dark Blue:** Kimi k1.5 long-CoT
* **Light Blue:** OpenAI o1
* **Very Light Blue:** OpenAI o1-mini
* **Medium Gray:** QVQ-72B-Preview
* **Light Gray:** QwQ-32B-Preview
* **Chart Structure:** The chart is divided into three vertical panels, each representing a domain:
1. **Left Panel - Math:** Contains two benchmark groups.
2. **Center Panel - Code:** Contains two benchmark groups.
3. **Right Panel - Vision:** Contains two benchmark groups.
* **X-Axis (Bottom):** Lists the six specific benchmarks, grouped by domain:
* **Math:** `AIME 2024 (Pass@1)` and `MATH 500 (EM)`
* **Code:** `Codeforces (Percentile)` and `LiveCodeBench v5 24.12-25.2 (Pass@1)`
* **Vision:** `MathVista (Pass@1)` and `MMMU (Pass@1)`
* **Y-Axis:** Not explicitly labeled with a scale or title. Performance is indicated by the height of the bars and the numerical labels on top of them. The metric varies by benchmark (e.g., Pass@1, EM, Percentile).
### Detailed Analysis
Performance scores for each model on each benchmark are as follows:
**1. Math Domain**
* **AIME 2024 (Pass@1):**
* Kimi k1.5 long-CoT: 77.5
* OpenAI o1: 74.4
* OpenAI o1-mini: 63.6
* QVQ-72B-Preview: 50
* QwQ-32B-Preview: (Bar present but no numerical label visible)
* **MATH 500 (EM):**
* Kimi k1.5 long-CoT: 98.2
* OpenAI o1: 94.8
* OpenAI o1-mini: 90
* QVQ-72B-Preview: 90.6
* QwQ-32B-Preview: (Bar present but no numerical label visible)
**2. Code Domain**
* **Codeforces (Percentile):**
* Kimi k1.5 long-CoT: 94
* OpenAI o1: 94
* OpenAI o1-mini: 88
* QVQ-72B-Preview: 62
* QwQ-32B-Preview: (Bar present but no numerical label visible)
* **LiveCodeBench v5 24.12-25.2 (Pass@1):**
* Kimi k1.5 long-CoT: 62.5
* OpenAI o1: 67.2
* OpenAI o1-mini: 53.1
* QVQ-72B-Preview: 40.6
* QwQ-32B-Preview: (Bar present but no numerical label visible)
**3. Vision Domain**
* **MathVista (Pass@1):**
* Kimi k1.5 long-CoT: 74.9
* OpenAI o1: 71
* OpenAI o1-mini: 71.4
* QVQ-72B-Preview: (Bar present but no numerical label visible)
* QwQ-32B-Preview: (Bar present but no numerical label visible)
* **MMMU (Pass@1):**
* Kimi k1.5 long-CoT: 70
* OpenAI o1: 77.3
* OpenAI o1-mini: 70.3
* QVQ-72B-Preview: (Bar present but no numerical label visible)
* QwQ-32B-Preview: (Bar present but no numerical label visible)
**Note on Missing Labels:** Several bars, primarily for the `QwQ-32B-Preview` model (light gray) and some for `QVQ-72B-Preview` (medium gray), do not have numerical scores displayed on top. Their relative heights can be inferred visually.
### Key Observations
1. **Model Leadership:** The `Kimi k1.5 long-CoT` (dark blue) model is the top performer or tied for top in 4 out of the 6 benchmarks (AIME 2024, MATH 500, Codeforces, MathVista).
2. **Strong Contender:** The `OpenAI o1` (light blue) model is highly competitive, leading in `LiveCodeBench v5` and `MMMU`, and tying for first in `Codeforces`.
3. **Domain Strengths:**
* **Math:** `Kimi k1.5 long-CoT` shows a clear lead on the AIME benchmark but is closely matched by others on MATH 500.
* **Code:** `Kimi k1.5 long-CoT` and `OpenAI o1` are virtually identical on the Codeforces percentile metric, but `OpenAI o1` has a noticeable lead on the LiveCodeBench pass@1 metric.
* **Vision:** Performance is more tightly clustered. `OpenAI o1` leads on MMMU, while `Kimi k1.5 long-CoT` leads on MathVista.
4. **Performance Drop-off:** The `OpenAI o1-mini` (very light blue) and the two "Preview" models (gray bars) generally score lower than the top two models across most benchmarks, with the `QwQ-32B-Preview` appearing to be the lowest-performing model where its bar height is visible.
### Interpretation
This chart provides a comparative snapshot of frontier AI model capabilities as of the data's collection date (likely early 2025, given the benchmark names). The data suggests a competitive landscape where no single model dominates all categories.
* **Specialization vs. Generalization:** `Kimi k1.5 long-CoT` demonstrates exceptional strength in mathematical reasoning and certain coding tasks, while `OpenAI o1` shows superior performance in other coding benchmarks and complex visual question answering (MMMU). This indicates potential specialization in model training or architecture.
* **Benchmark Sensitivity:** The varying rankings across benchmarks (e.g., the flip between Kimi and OpenAI o1 on the two Code benchmarks) highlight that model evaluation is highly sensitive to the specific task and metric used. A model's "capability" is not a single number but a profile across diverse challenges.
* **The "Preview" Gap:** The significant performance gap between the established models (Kimi, OpenAI o1) and the "Preview" models (QVQ, QwQ) suggests these are either less mature, smaller, or differently optimized models, possibly representing a different tier of capability or a work in progress.
* **Implication for Users:** The choice of model would depend heavily on the primary use case. For math-heavy applications, Kimi k1.5 long-CoT appears strongest. For a mix of coding and visual reasoning, OpenAI o1 is a very strong contender. The chart argues against a one-size-fits-all approach to model selection.