## Line Chart Grid: Open-loop pulsed programming of the CMO-HfOx ReRAM array
### Overview
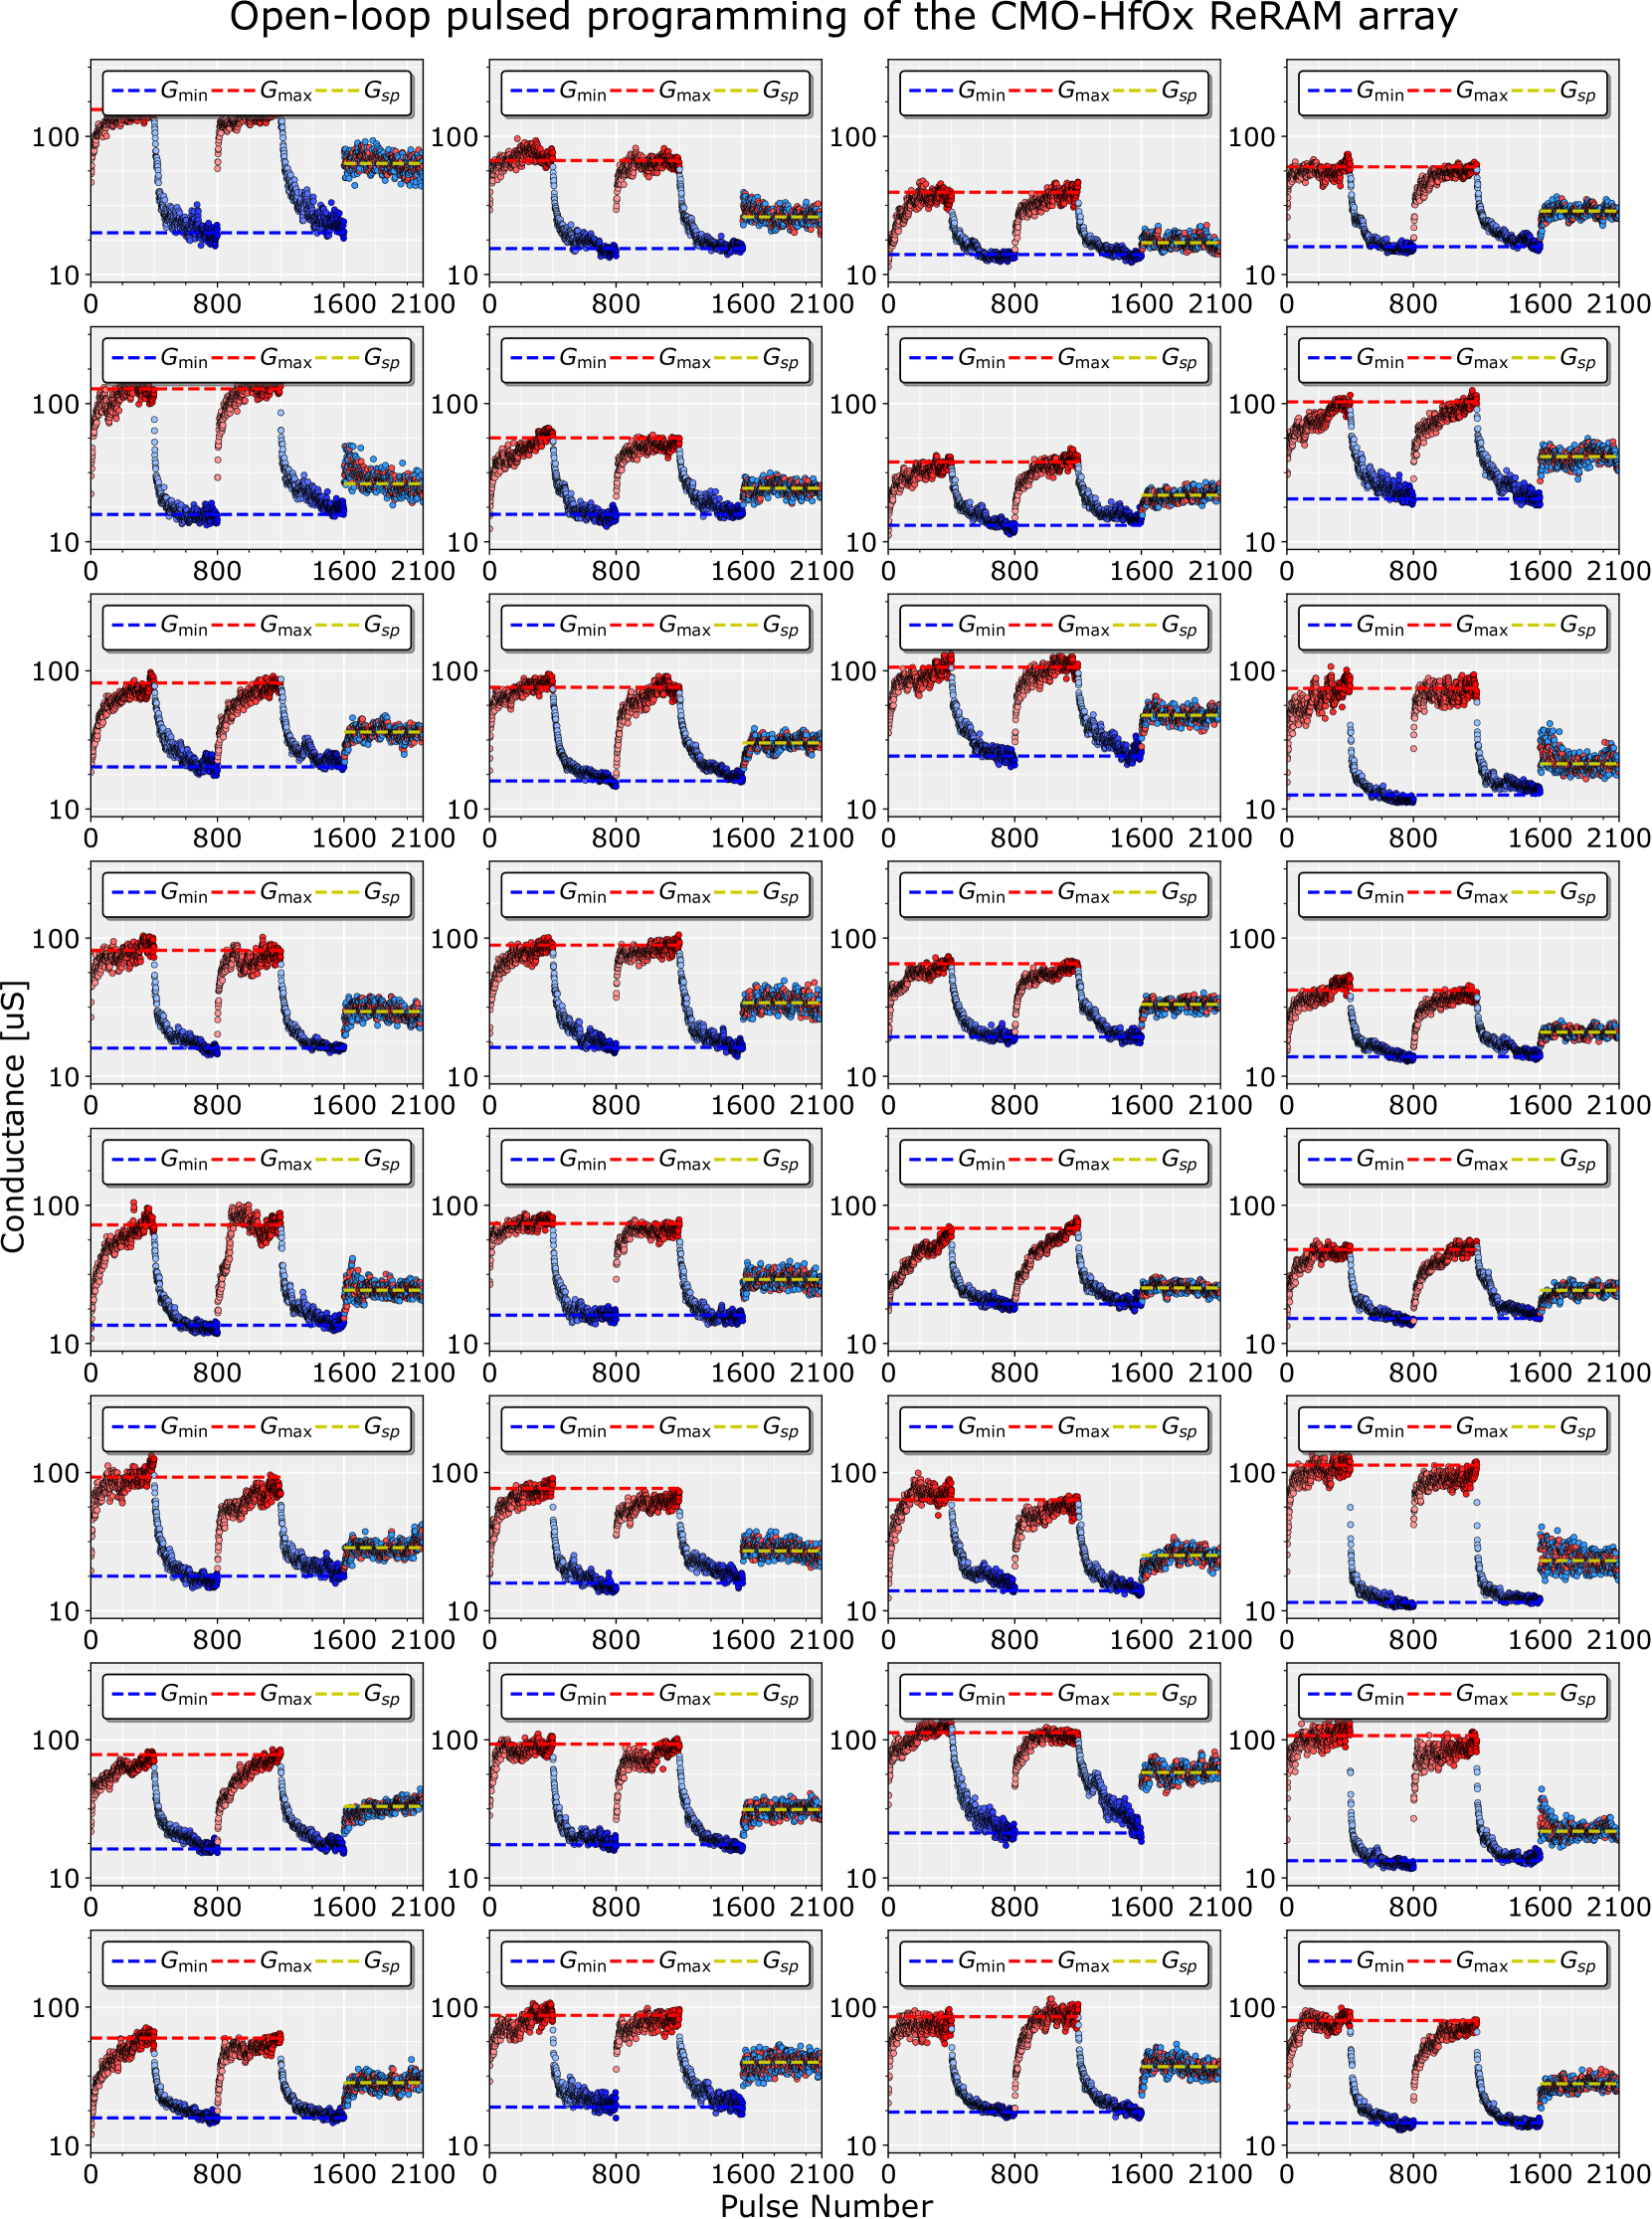
The image displays a grid of 32 identical line charts arranged in an 8-row by 4-column matrix. Each chart plots the conductance of a CMO-HfOx Resistive RAM (ReRAM) device over a series of programming pulses. The overall title is "Open-loop pulsed programming of the CMO-HfOx ReRAM array." The charts demonstrate the characteristic switching behavior of these devices under a specific pulsed voltage scheme.
### Components/Axes
* **Main Title:** "Open-loop pulsed programming of the CMO-HfOx ReRAM array" (centered at the top).
* **Grid Structure:** 8 rows x 4 columns of individual subplots.
* **X-Axis (Common to all plots):** Label: "Pulse Number". Scale: Linear, from 0 to 2100. Major tick marks at 0, 800, 1600, and 2100.
* **Y-Axis (Common to all plots):** Label: "Conductance [uS]" (microSiemens). Scale: Logarithmic, spanning from 10 to 100 uS.
* **Legend (Present in the top-left corner of every subplot):**
* `G_min`: Blue dashed line.
* `G_max`: Red dashed line.
* `G_sp`: Yellow dashed line.
* **Data Series:** Each plot contains three distinct data series represented by colored dots:
* **Blue dots:** Correspond to the `G_min` series.
* **Red dots:** Correspond to the `G_max` series.
* **Yellow dots:** Correspond to the `G_sp` series.
### Detailed Analysis
Each of the 32 subplots shows a nearly identical pattern of conductance evolution:
1. **Initial State (Pulse 0 ~ 800):**
* **Trend:** Conductance starts at a high level.
* **Values:** Both `G_max` (red) and `G_min` (blue) begin clustered near the top of the scale, approximately between 60-100 uS. The red dots (`G_max`) are consistently at the upper edge of this cluster, while the blue dots (`G_min`) are slightly lower.
2. **First Transition (Around Pulse 800):**
* **Trend:** A sharp, precipitous drop in conductance occurs.
* **Values:** Conductance for both series falls rapidly from the ~60-100 uS range down to the ~10-20 uS range. This represents a transition from a Low Resistance State (LRS) to a High Resistance State (HRS).
3. **Intermediate State (Pulse 800 ~ 1600):**
* **Trend:** Conductance remains stable at the low level.
* **Values:** Data points for both `G_max` and `G_min` are tightly clustered between approximately 10 and 20 uS.
4. **Second Transition (Around Pulse 1600):**
* **Trend:** A sharp, rapid increase in conductance occurs.
* **Values:** Conductance jumps from the ~10-20 uS range back up to a level between approximately 30-60 uS. This is a transition from the HRS back to an intermediate or LRS.
5. **Final State (Pulse 1600 ~ 2100):**
* **Trend:** Conductance stabilizes at a new, intermediate level.
* **Values:** The `G_sp` (yellow) data series appears exclusively in this region. These points form a tight, stable band between approximately 30 and 50 uS. The `G_max` (red) and `G_min` (blue) series also converge to this same band, indicating the device has settled into a specific programmed state.
### Key Observations
* **High Uniformity:** All 32 devices in the array exhibit remarkably consistent switching behavior. The pulse numbers for transitions (~800 and ~1600) and the conductance levels for each state are highly reproducible across the grid.
* **Bipolar Switching:** The device demonstrates clear bipolar switching: a SET process (increase in conductance) around pulse 1600 and a RESET process (decrease in conductance) around pulse 800.
* **Distinct States:** Three primary conductance states are visible: a high-conductance initial state (>60 uS), a low-conductance state (~10-20 uS), and a final, stable intermediate state (~30-50 uS) labeled `G_sp`.
* **Data Series Relationship:** The `G_max` (red) and `G_min` (blue) series track each other closely throughout the pulse sequence, defining the upper and lower bounds of conductance noise or variability at any given pulse. The `G_sp` (yellow) series represents the target or settled state after the final programming phase.
### Interpretation
This data characterizes the fundamental analog switching properties of a CMO-HfOx ReRAM device under open-loop control. The consistent, repeatable transitions across 32 devices are crucial for memory array reliability.
* **What the data demonstrates:** The charts show a deliberate, two-step programming sequence. The first ~800 pulses likely apply a RESET voltage to drive the device to a high-resistance state. The subsequent ~800 pulses (800-1600) maintain this state. The final ~500 pulses (1600-2100) apply a different (likely lower amplitude or opposite polarity) SET voltage to carefully tune the device to a specific, stable intermediate conductance level (`G_sp`). This is indicative of an analog or multi-level cell (MLC) programming scheme.
* **Relationship between elements:** The `G_min` and `G_max` lines act as dynamic boundaries, showing the range of conductance fluctuation during the programming pulses. The convergence of all three data series (`G_min`, `G_max`, `G_sp`) in the final region confirms successful programming to a stable target state with minimal variability.
* **Significance:** The uniformity across the array is a positive indicator for the potential use of this technology in high-density memory or neuromorphic computing applications, where consistent device-to-device behavior is essential. The ability to precisely settle at an intermediate conductance (`G_sp`) is key for implementing synaptic weights in analog hardware. The clear separation between states suggests a good on/off ratio, which is beneficial for read margins in memory applications.