## Chart/Diagram Type: Open-loop Pulsed Programming of CMO-HfO₂ ReRAM Array
### Overview
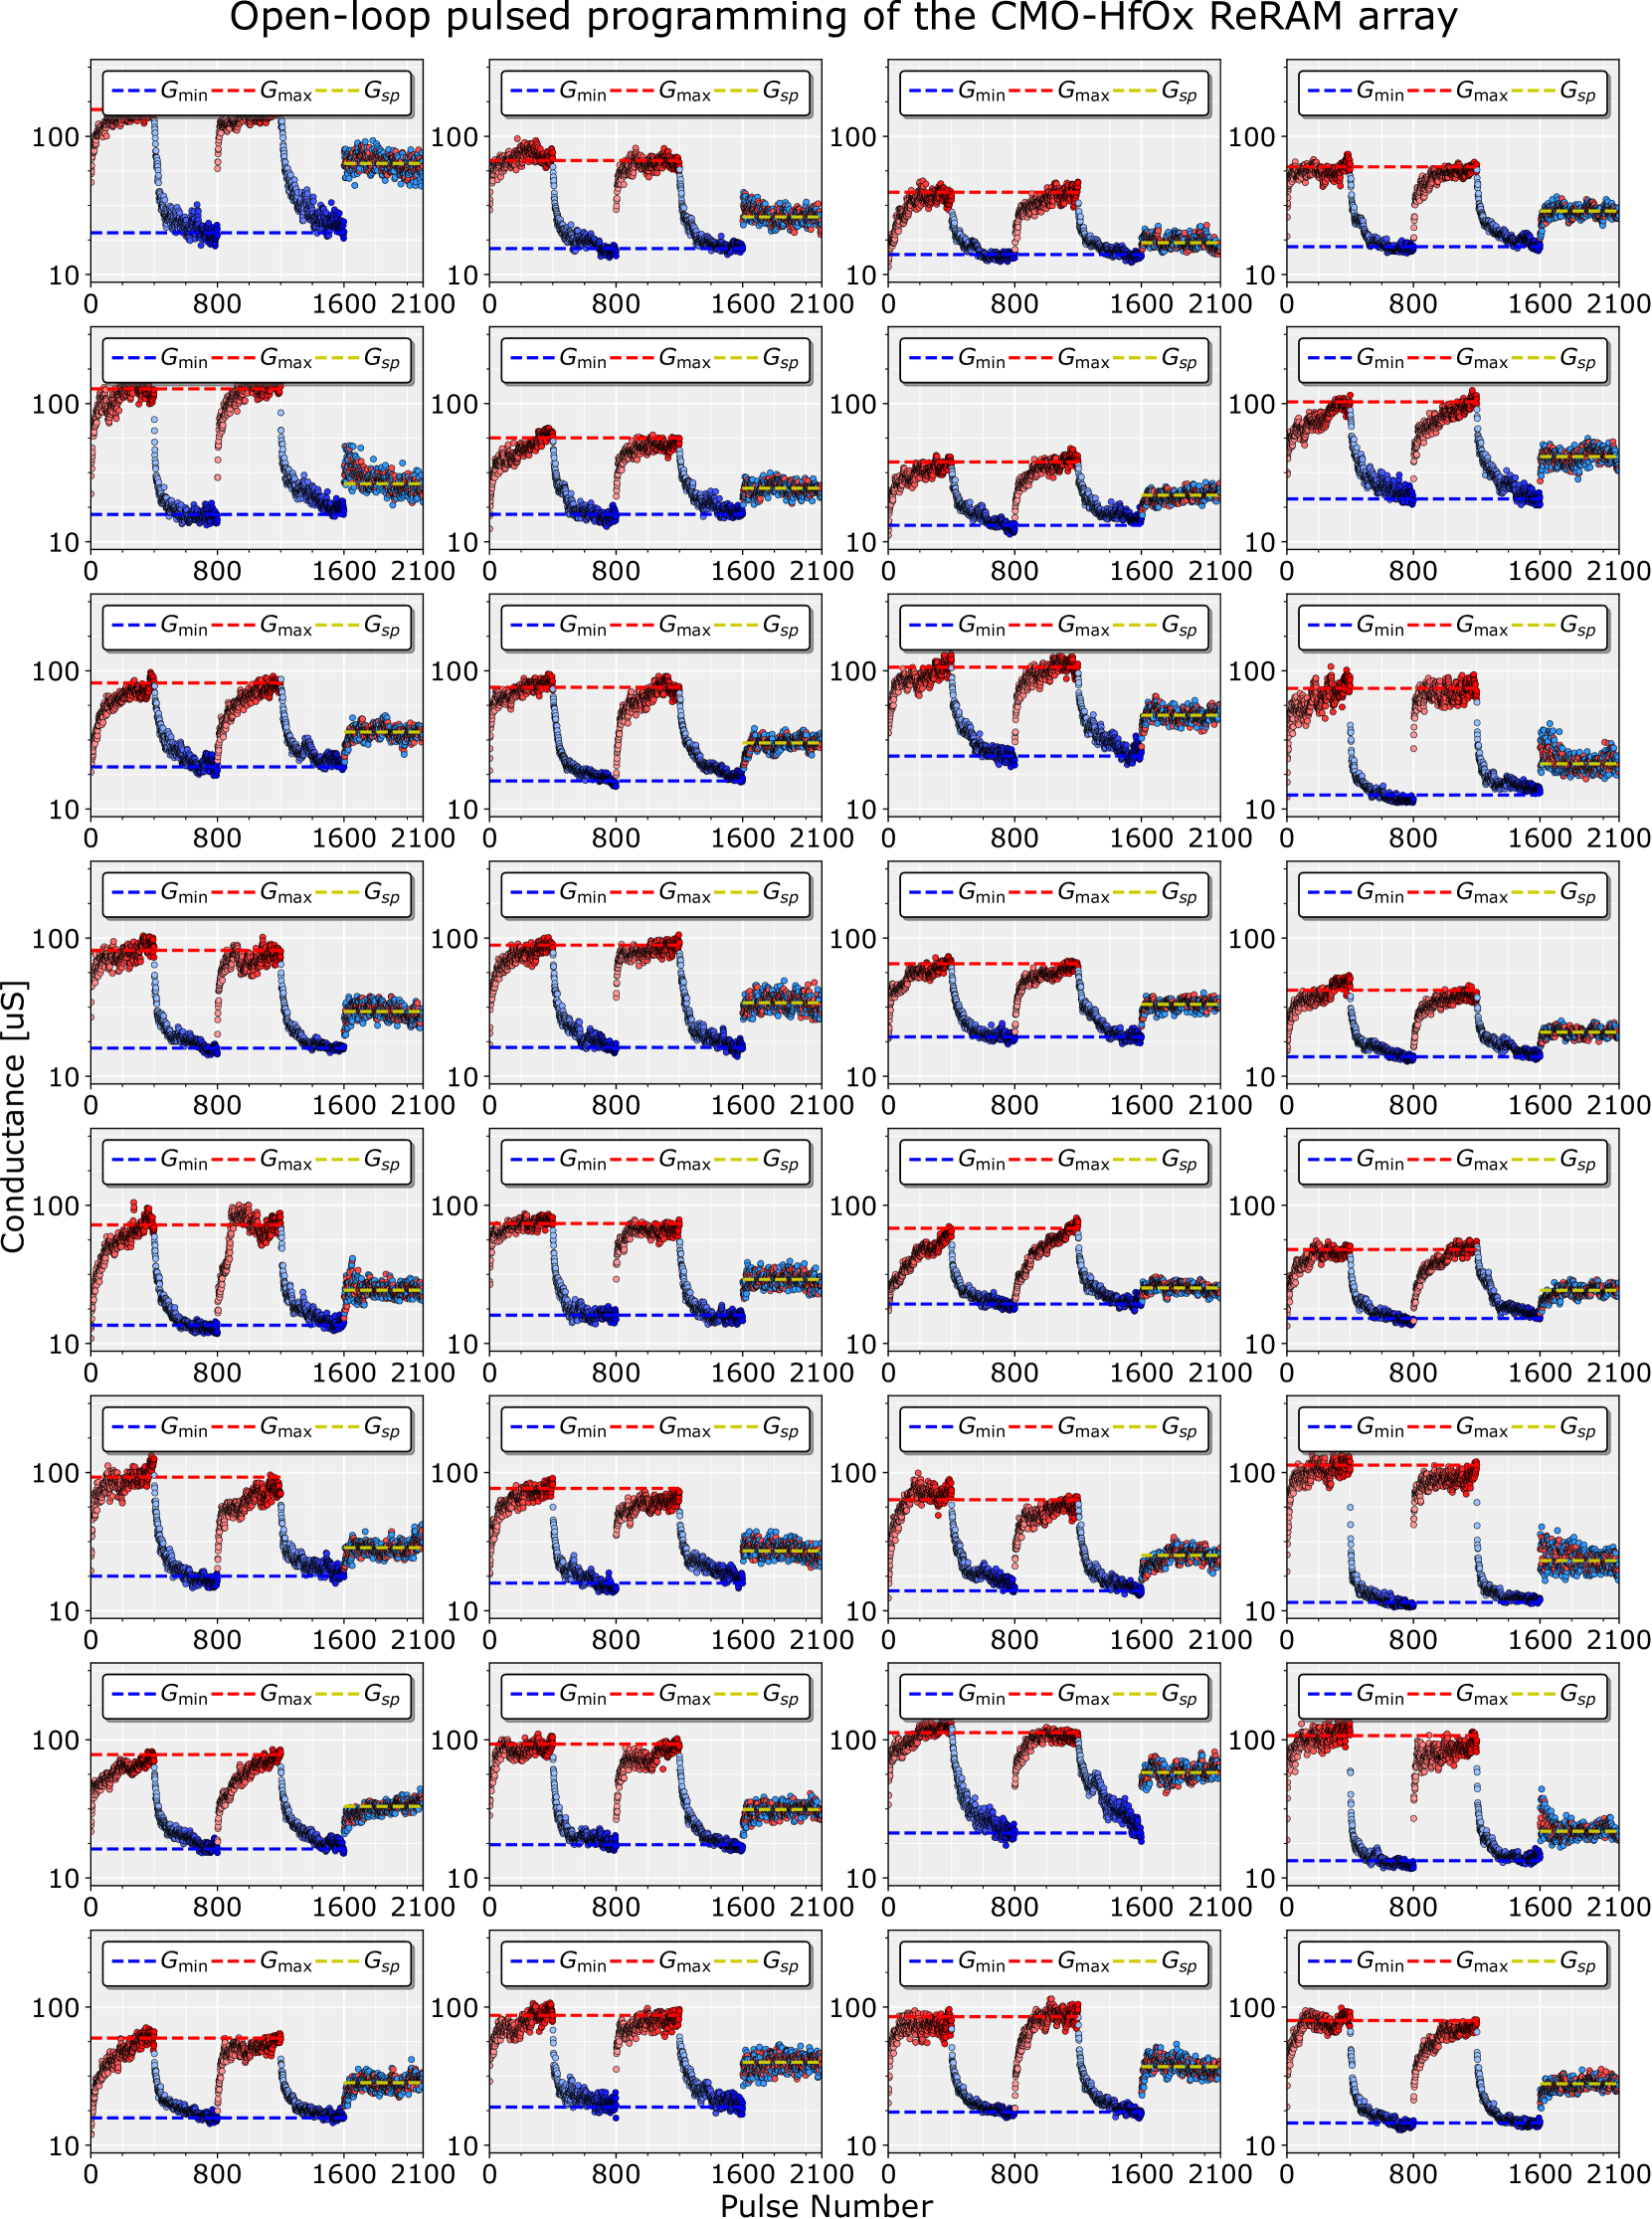
The image displays 16 subplots arranged in a 4x4 grid, each illustrating conductance (G) measurements over pulse numbers during open-loop pulsed programming of a CMO-HfO₂ resistive random-access memory (ReRAM) array. Conductance is plotted on a logarithmic scale (10–100 μS), while pulse numbers range linearly from 0 to 2100. Each subplot includes three reference lines: G_min (blue dashed), G_max (red dashed), and G_sp (yellow dashed), with data points in blue and red.
---
### Components/Axes
- **X-axis**: Pulse Number (0–2100, linear scale).
- **Y-axis**: Conductance (G) in micro-siemens (μS), logarithmic scale (10–100 μS).
- **Legend**:
- G_min (blue dashed line): Minimum conductance threshold.
- G_max (red dashed line): Maximum conductance threshold.
- G_sp (yellow dashed line): Target/set-point conductance.
- **Data Points**:
- Blue: Low-conductance state (LRS).
- Red: High-conductance state (HRS).
---
### Detailed Analysis
1. **Trends**:
- All subplots show a biphasic conductance response:
- **Rising Phase**: Conductance increases from ~10 μS (blue points) to ~100 μS (red points) as pulse numbers approach ~800–1600.
- **Falling Phase**: Conductance drops sharply after ~1600 pulses, returning toward ~10 μS.
- G_sp (yellow dashed line) consistently aligns with the peak conductance (~100 μS) in most subplots.
- G_min and G_max lines bound the data points, with G_min (~10 μS) and G_max (~100 μS) representing the operational range.
2. **Data Points**:
- Blue points (LRS) dominate the early and late pulse numbers.
- Red points (HRS) cluster near the peak conductance (~100 μS) during the rising phase.
- Variability in data point density suggests device-to-device or pulse-to-pulse noise.
3. **Axis Markers**:
- X-axis ticks at 0, 800, 1600, 2100.
- Y-axis ticks at 10, 100 μS.
---
### Key Observations
- **Consistent Biphasic Behavior**: All subplots exhibit identical rising-falling conductance patterns, indicating reproducible switching dynamics.
- **G_sp Alignment**: The yellow dashed line (G_sp) matches the peak conductance in most subplots, suggesting it represents a target state for programming.
- **Device Variability**: Subtle differences in pulse-number thresholds for conductance transitions (e.g., ~800 vs. ~1200 pulses) may reflect device heterogeneity.
- **Noise**: Scattered data points at low conductance (blue) indicate measurement uncertainty or stochastic switching.
---
### Interpretation
This dataset demonstrates the open-loop pulsed programming of a CMO-HfO₂ ReRAM array, where conductance transitions between LRS and HRS are driven by repeated voltage pulses. The G_sp line likely represents the target conductance for a specific memory state (e.g., "1" in binary logic). The consistent biphasic response across subplots confirms the reproducibility of the switching mechanism, while variability in pulse-number thresholds highlights challenges in device uniformity. The logarithmic y-axis emphasizes the exponential nature of conductance changes during programming, critical for understanding ReRAM's non-volatile memory properties. Outliers in the falling phase (e.g., red points near G_min) may indicate incomplete switching or measurement artifacts.