## Line Chart: GovReport Dataset Analysis
### Overview
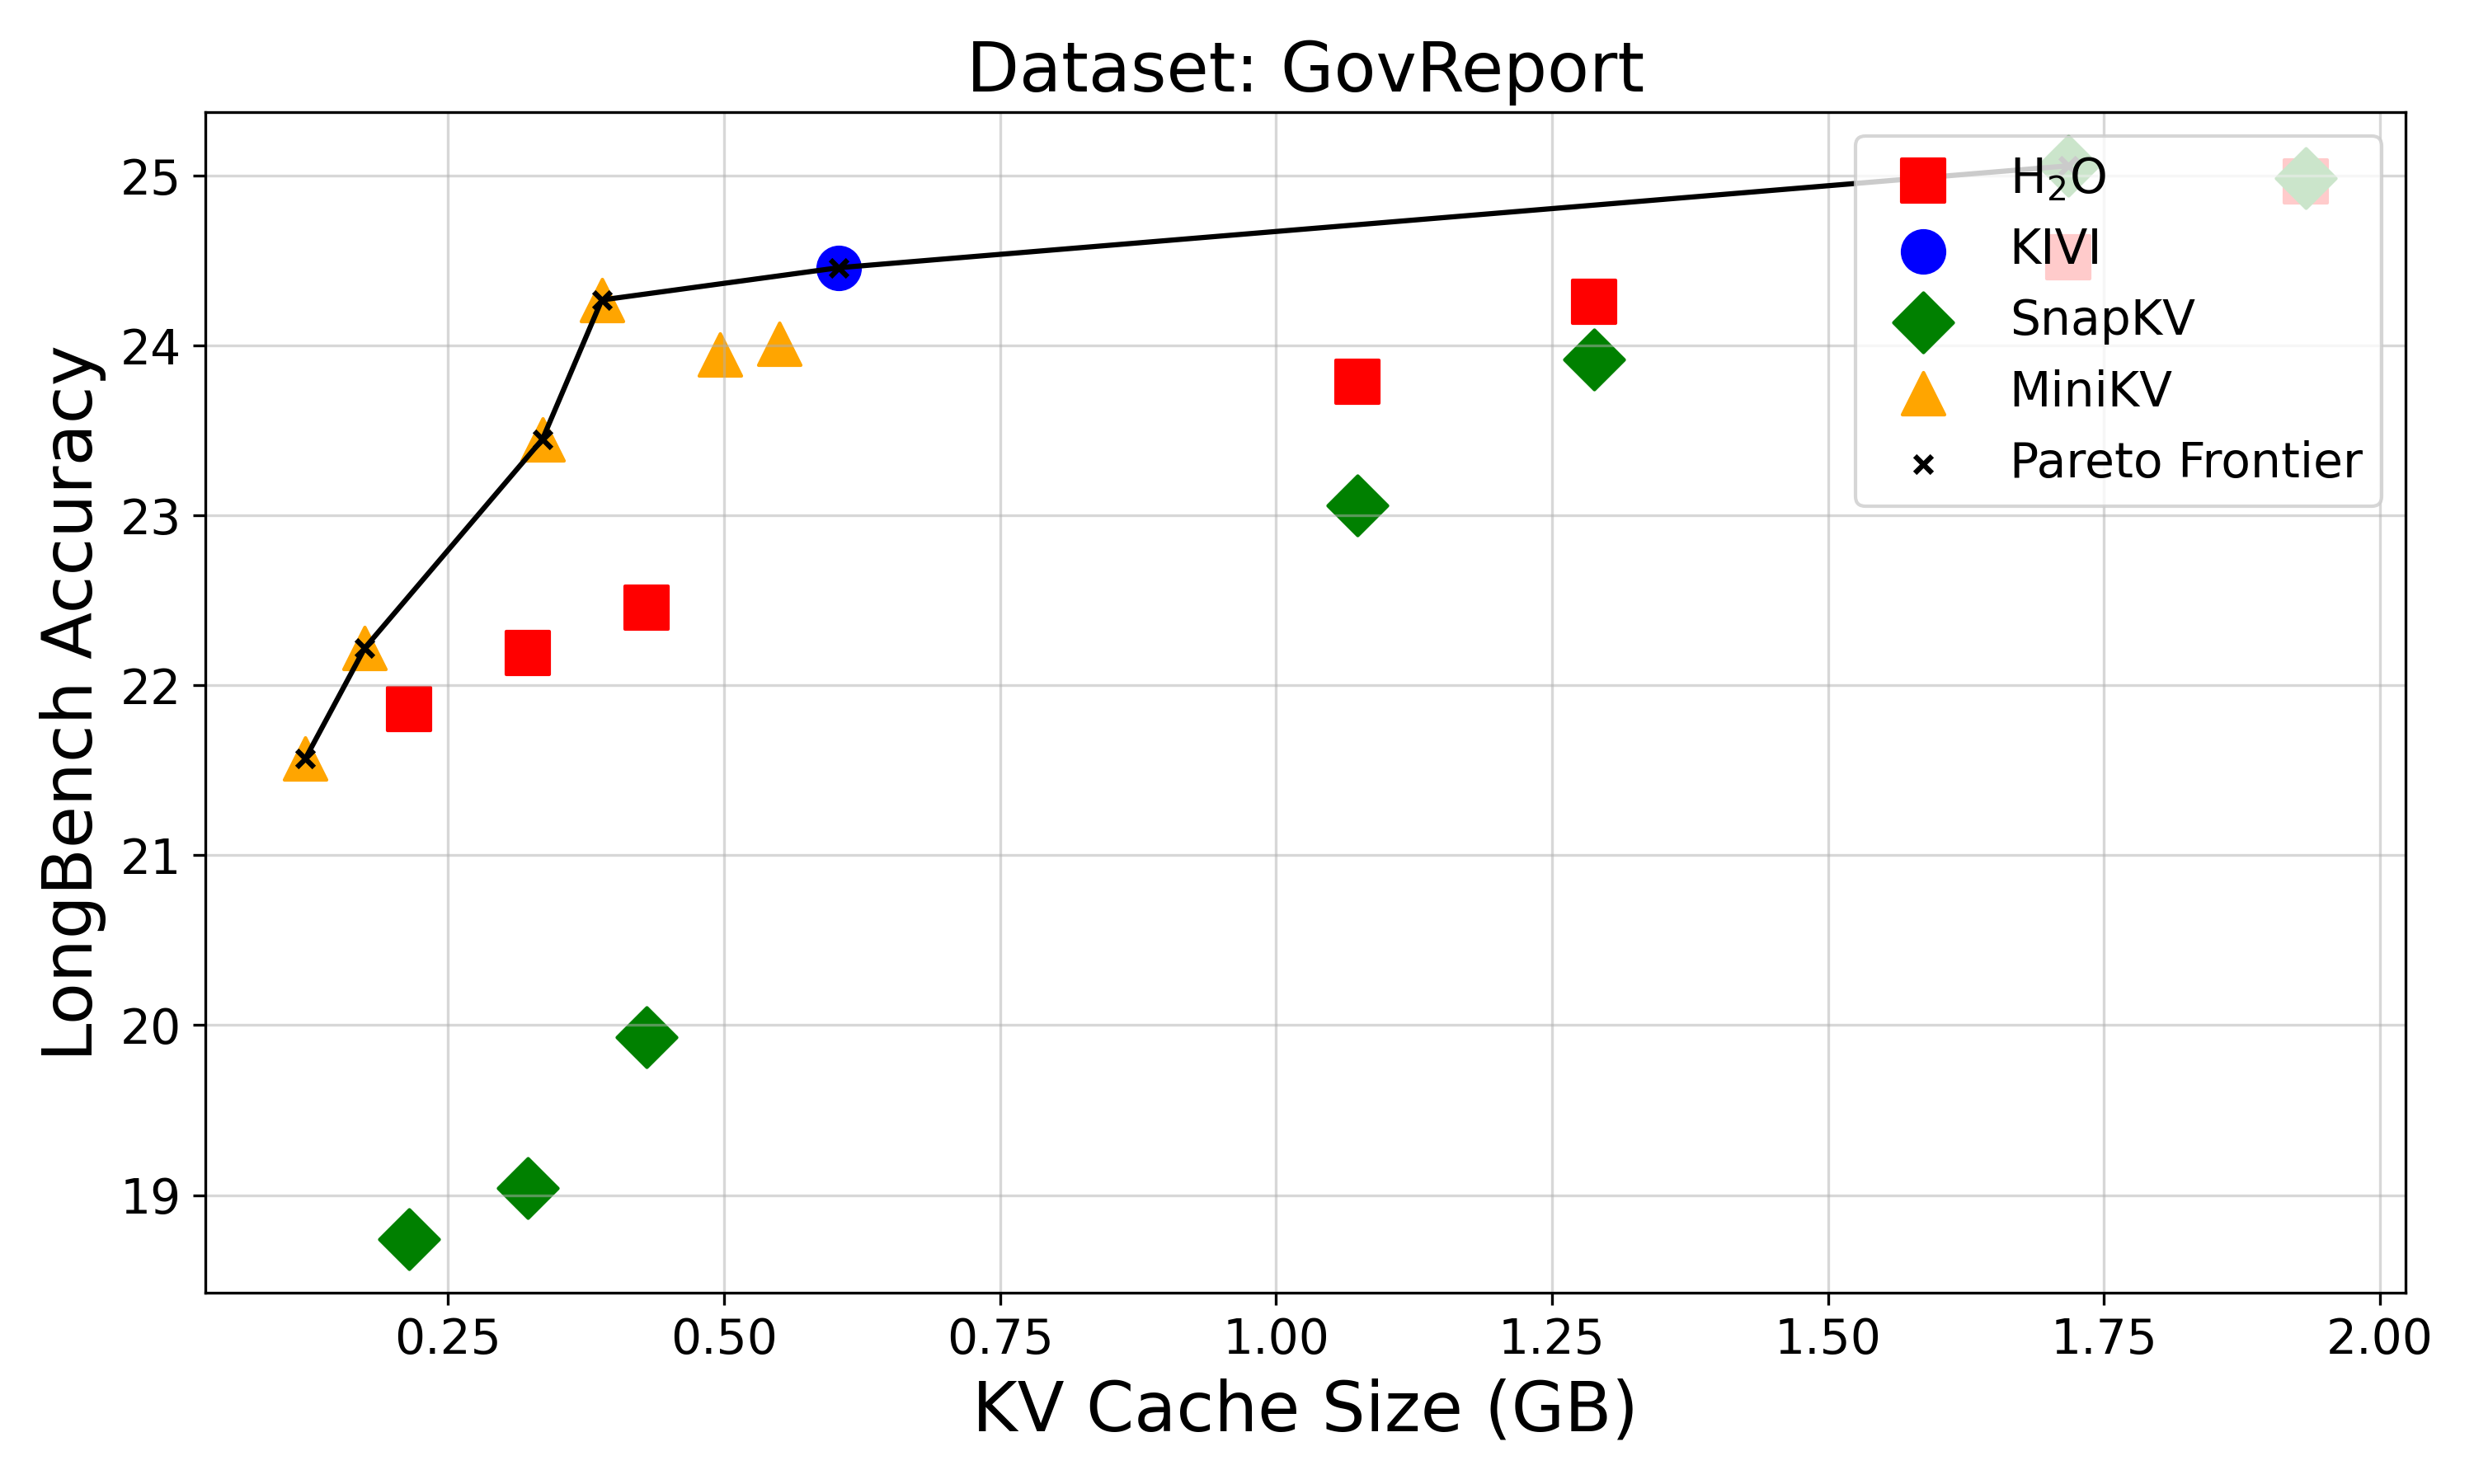
The image is a line chart titled "Dataset: GovReport," comparing the relationship between KV Cache Size (in GB) and LongBench Accuracy across different algorithms. The chart includes a Pareto Frontier line and data points for five algorithms: H2O, KIVI, SnapKV, MiniKV, and Pareto Frontier. The x-axis represents KV Cache Size (GB), ranging from 0.25 to 2.00 GB, while the y-axis represents LongBench Accuracy, ranging from 19 to 25.
### Components/Axes
- **X-axis (KV Cache Size)**: Labeled "KV Cache Size (GB)" with ticks at 0.25, 0.50, 0.75, 1.00, 1.25, 1.50, 1.75, and 2.00 GB.
- **Y-axis (LongBench Accuracy)**: Labeled "LongBench Accuracy" with ticks at 19, 20, 21, 22, 23, 24, and 25.
- **Legend**: Located in the top-right corner, with the following mappings:
- Red squares: H2O
- Blue circle: KIVI
- Green diamonds: SnapKV
- Yellow triangles: MiniKV
- Black crosses: Pareto Frontier
### Detailed Analysis
- **Pareto Frontier (Black Crosses)**:
- Starts at approximately (0.25 GB, 21.5) and increases steadily to (2.00 GB, 25).
- Represents the optimal trade-off between cache size and accuracy.
- **H2O (Red Squares)**:
- Data points at (0.25 GB, 22), (0.50 GB, 22.5), (1.00 GB, 23.8), and (1.25 GB, 24.2).
- Shows a gradual upward trend but remains below the Pareto Frontier.
- **KIVI (Blue Circle)**:
- Single data point at (0.75 GB, 24.5), positioned above the Pareto Frontier.
- **SnapKV (Green Diamonds)**:
- Data points at (0.25 GB, 18.8), (0.50 GB, 19.9), (1.00 GB, 23.1), and (1.25 GB, 23.9).
- Starts below the Pareto Frontier but improves with larger cache sizes.
- **MiniKV (Yellow Triangles)**:
- Data points at (0.25 GB, 21.5), (0.50 GB, 23.5), and (0.75 GB, 24.2).
- Shows a strong upward trend, approaching the Pareto Frontier.
### Key Observations
1. **Pareto Frontier Dominance**: The Pareto Frontier line consistently represents the highest achievable accuracy for each cache size, acting as a benchmark.
2. **Algorithm Performance**:
- **KIVI** and **MiniKV** outperform other algorithms at specific cache sizes, with KIVI reaching 24.5 accuracy at 0.75 GB.
- **SnapKV** lags at smaller cache sizes (e.g., 18.8 at 0.25 GB) but improves significantly at larger sizes.
- **H2O** and **MiniKV** show steady improvements but remain below the Pareto Frontier.
3. **Outliers**: The Pareto Frontier itself is not an algorithm but a theoretical boundary, while KIVI and MiniKV occasionally surpass it at certain points.
### Interpretation
The chart illustrates the trade-off between KV Cache Size and LongBench Accuracy for different algorithms. The Pareto Frontier highlights the optimal performance achievable for each cache size, serving as a reference for evaluating algorithm efficiency.
- **KIVI** and **MiniKV** demonstrate superior performance at specific cache sizes, suggesting they are more efficient or optimized for certain workloads.
- **SnapKV** underperforms at smaller cache sizes but improves with larger allocations, indicating potential scalability.
- **H2O** and **MiniKV** show consistent growth but do not reach the Pareto Frontier, implying room for optimization.
The data suggests that while larger cache sizes generally improve accuracy, the efficiency of algorithms varies significantly. The Pareto Frontier underscores the importance of balancing cache size and algorithmic design to achieve optimal results.