\n
## Diagram: Neural Network for Room Completion
### Overview
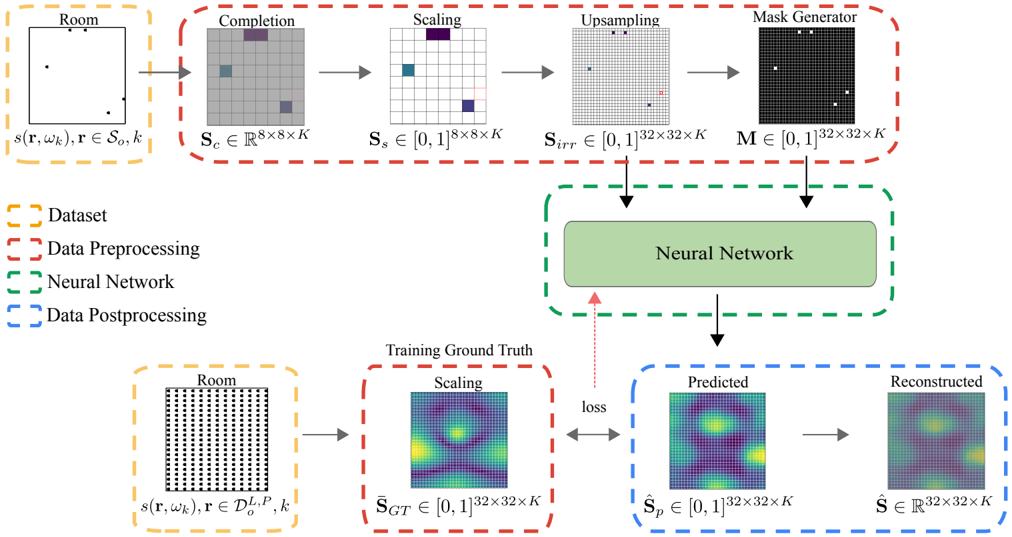
This diagram illustrates a neural network pipeline for completing a room scene from a partial observation. The process involves data preprocessing, a neural network core, and data postprocessing, with a training loop for optimization. The diagram shows the flow of data through these stages, along with the mathematical notation representing the dimensions of the data at each step.
### Components/Axes
The diagram is divided into two main sections: the forward pass (top row) and the training loop (bottom row). Each section is further divided into stages: Room, Completion, Scaling, Upsampling, Mask Generator (top row) and Room, Scaling, Predicted, Reconstructed (bottom row). A central "Neural Network" block connects the two sections.
The legend, located in the bottom-left corner, defines the color-coding for different data types:
- Yellow dashed line: Dataset
- Red dashed line: Data Preprocessing
- Green solid line: Neural Network
- Blue dashed line: Data Postprocessing
Mathematical notations are used to define the dimensions of the data at each stage.
### Detailed Analysis or Content Details
**Forward Pass (Top Row):**
1. **Room:** Input is `s(r, ωk)`, where `r ∈ S0, k`. The output is a visual representation of a room scene.
2. **Completion:** The output `Sc ∈ ℝ8x8xK` represents the completed scene.
3. **Scaling:** The completed scene is scaled to `Ss ∈ [0, 1]8x8xK`.
4. **Upsampling:** The scaled scene is upsampled to `Sirr ∈ [0, 1]32x32xK`.
5. **Mask Generator:** A mask is generated `M ∈ [0, 1]32x32xK`.
**Training Loop (Bottom Row):**
1. **Room:** Input is `s(r, ωk)`, where `r ∈ D0, P, k`. The output is a visual representation of a room scene.
2. **Scaling:** The ground truth is scaled to `SGT ∈ [0, 1]32x32xK`.
3. **Predicted:** The neural network predicts the completed scene `Sp ∈ [0, 1]32x32xK`.
4. **Reconstructed:** The reconstructed scene is `S ∈ ℝ32x32xK`.
**Central Neural Network:**
The "Neural Network" block receives the upsampled image and the training ground truth as inputs. It outputs the predicted scene, which is then compared to the ground truth to calculate a "loss" value. This loss is used to update the network's weights during training.
**Data Flow:**
Arrows indicate the flow of data between stages. Dashed arrows represent data flow associated with the legend's color-coding.
### Key Observations
The diagram highlights the key stages involved in room completion using a neural network. The use of mathematical notation emphasizes the quantitative nature of the process. The training loop demonstrates how the network learns to minimize the difference between its predictions and the ground truth. The diagram clearly separates the preprocessing, network core, and postprocessing stages.
### Interpretation
The diagram illustrates a supervised learning approach to room completion. The neural network is trained to predict a complete scene given a partial observation. The scaling and upsampling stages suggest that the network operates on normalized and resized images. The mask generator likely plays a role in identifying and filling in missing parts of the scene. The loss function quantifies the error between the predicted and ground truth scenes, guiding the network's learning process. The overall goal is to develop a neural network that can accurately and realistically complete room scenes from incomplete data. The use of mathematical notation suggests a focus on precise control and optimization of the network's performance. The diagram is a high-level overview and does not provide details about the specific architecture or training procedure of the neural network.