## Line Chart: Accuracy vs. Sample Size
### Overview
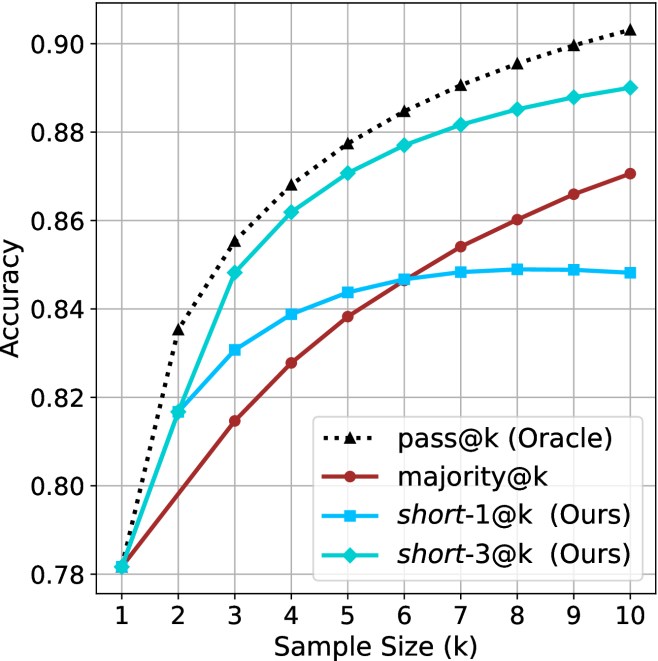
The image is a line chart comparing the accuracy of different methods ("pass@k (Oracle)", "majority@k", "short-1@k (Ours)", and "short-3@k (Ours)") as a function of sample size (k), ranging from 1 to 10. The y-axis represents accuracy, ranging from 0.78 to 0.90.
### Components/Axes
* **X-axis:** Sample Size (k), with tick marks at integers from 1 to 10.
* **Y-axis:** Accuracy, with tick marks at 0.78, 0.80, 0.82, 0.84, 0.86, 0.88, and 0.90.
* **Legend:** Located in the bottom-right corner, it identifies the lines:
* Black dotted line with triangles: pass@k (Oracle)
* Brown solid line with circles: majority@k
* Blue solid line with squares: short-1@k (Ours)
* Teal solid line with diamonds: short-3@k (Ours)
### Detailed Analysis
* **pass@k (Oracle):** (Black dotted line with triangles)
* Trend: Slopes sharply upward, then plateaus.
* Data Points:
* k=1: ~0.78
* k=2: ~0.83
* k=3: ~0.86
* k=4: ~0.87
* k=5: ~0.88
* k=6: ~0.88
* k=7: ~0.89
* k=8: ~0.89
* k=9: ~0.90
* k=10: ~0.90
* **majority@k:** (Brown solid line with circles)
* Trend: Slopes upward, but at a decreasing rate.
* Data Points:
* k=1: ~0.78
* k=2: ~0.80
* k=3: ~0.81
* k=4: ~0.82
* k=5: ~0.83
* k=6: ~0.84
* k=7: ~0.85
* k=8: ~0.86
* k=9: ~0.86
* k=10: ~0.87
* **short-1@k (Ours):** (Blue solid line with squares)
* Trend: Slopes upward, then plateaus.
* Data Points:
* k=1: ~0.78
* k=2: ~0.82
* k=3: ~0.83
* k=4: ~0.84
* k=5: ~0.84
* k=6: ~0.85
* k=7: ~0.85
* k=8: ~0.85
* k=9: ~0.85
* k=10: ~0.85
* **short-3@k (Ours):** (Teal solid line with diamonds)
* Trend: Slopes upward, then plateaus.
* Data Points:
* k=1: ~0.78
* k=2: ~0.82
* k=3: ~0.85
* k=4: ~0.86
* k=5: ~0.87
* k=6: ~0.87
* k=7: ~0.88
* k=8: ~0.88
* k=9: ~0.89
* k=10: ~0.89
### Key Observations
* "pass@k (Oracle)" consistently achieves the highest accuracy across all sample sizes.
* "short-3@k (Ours)" performs better than "short-1@k (Ours)" and "majority@k".
* "majority@k" has the lowest accuracy among the four methods.
* All methods show diminishing returns in accuracy as the sample size increases beyond a certain point.
### Interpretation
The chart demonstrates the relationship between sample size and accuracy for different methods. The "pass@k (Oracle)" method serves as an upper bound or ideal performance, while the other methods ("majority@k", "short-1@k (Ours)", and "short-3@k (Ours)") show varying degrees of improvement with increasing sample size. The "short-3@k (Ours)" method appears to be a more effective approach than "short-1@k (Ours)" and "majority@k". The plateauing of accuracy suggests that there is a limit to the benefits of increasing the sample size for these methods. The data suggests that "short-3@k" is a good compromise between the oracle and the majority vote.