## Line Chart: Accuracy vs. Sample Size (k)
### Overview
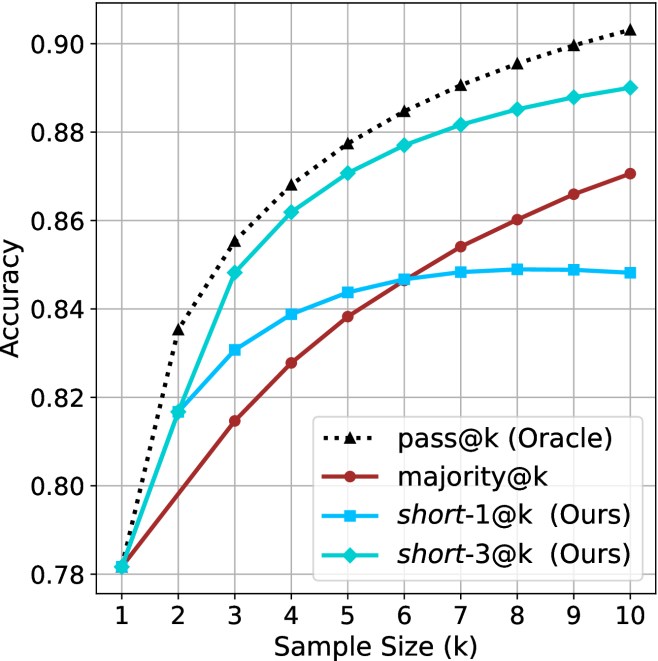
This chart illustrates the performance (Accuracy) of four different evaluation methods across varying sample sizes (k=1 to 10). The chart demonstrates how accuracy scales as the sample size increases, with one method acting as a theoretical upper bound ("Oracle").
### Components/Axes
* **X-Axis:** Labeled "Sample Size (k)". The scale is linear, ranging from 1 to 10 in integer increments.
* **Y-Axis:** Labeled "Accuracy". The scale ranges from 0.78 to 0.90, with grid lines at 0.02 intervals.
* **Legend:** Positioned in the bottom-right quadrant of the chart area.
* **Black dotted line with triangle markers:** `pass@k (Oracle)`
* **Dark red solid line with circle markers:** `majority@k`
* **Light blue solid line with square markers:** `short-1@k (Ours)`
* **Teal solid line with diamond markers:** `short-3@k (Ours)`
### Detailed Analysis
All four data series originate from a single point at k=1, with an accuracy of approximately 0.782.
**Data Series Trends and Values (Approximate):**
| Sample Size (k) | pass@k (Oracle) | short-3@k (Ours) | majority@k | short-1@k (Ours) |
| :--- | :--- | :--- | :--- | :--- |
| **1** | ~0.782 | ~0.782 | ~0.782 | ~0.782 |
| **2** | ~0.835 | ~0.817 | ~0.798 | ~0.817 |
| **3** | ~0.855 | ~0.848 | ~0.815 | ~0.831 |
| **4** | ~0.868 | ~0.862 | ~0.828 | ~0.839 |
| **5** | ~0.878 | ~0.871 | ~0.838 | ~0.844 |
| **6** | ~0.885 | ~0.877 | ~0.847 | ~0.847 |
| **7** | ~0.891 | ~0.882 | ~0.854 | ~0.848 |
| **8** | ~0.896 | ~0.885 | ~0.860 | ~0.849 |
| **9** | ~0.900 | ~0.888 | ~0.866 | ~0.849 |
| **10** | ~0.903 | ~0.890 | ~0.871 | ~0.848 |
* **pass@k (Oracle):** Shows the steepest upward trajectory, consistently maintaining the highest accuracy across all sample sizes. The rate of growth slows slightly as k increases (concave down).
* **short-3@k (Ours):** Tracks closely below the Oracle line. It maintains a strong upward trend throughout the range, ending as the second-highest performer.
* **majority@k:** Starts with the lowest accuracy (after k=1) but exhibits a very consistent, nearly linear upward trend. It intersects with `short-1@k` at approximately k=6.
* **short-1@k (Ours):** Initially performs well (tied with `short-3@k` at k=2), but the growth rate diminishes rapidly after k=4, effectively plateauing around k=6 to k=7.
### Key Observations
* **Convergence:** All methods start at the same baseline accuracy at k=1.
* **Performance Crossover:** At k=6, the `majority@k` method overtakes the `short-1@k` method.
* **Diminishing Returns:** The `short-1@k` method shows clear signs of saturation, where increasing the sample size beyond k=6 yields negligible improvements in accuracy.
* **Oracle Gap:** The gap between the `pass@k` (Oracle) and the best-performing "Ours" method (`short-3@k`) remains relatively constant, suggesting that while `short-3@k` is effective, there is a consistent performance ceiling compared to the Oracle.
### Interpretation
The data suggests that `short-3@k` is a more robust strategy than `short-1@k`, as it continues to scale effectively with larger sample sizes, whereas `short-1@k` hits a hard limit. The `majority@k` method is a "slow and steady" approach; while it starts weaker, it is the most reliable method for larger sample sizes (k > 6), likely because it benefits more from the increased statistical confidence provided by larger samples. The "Oracle" line represents the theoretical maximum performance, and the gap between it and the other lines indicates the efficiency loss inherent in the selection strategies used by the "Ours" methods.