## Diagram: Transformation Process of Looped Lines to Straight Lines
### Overview
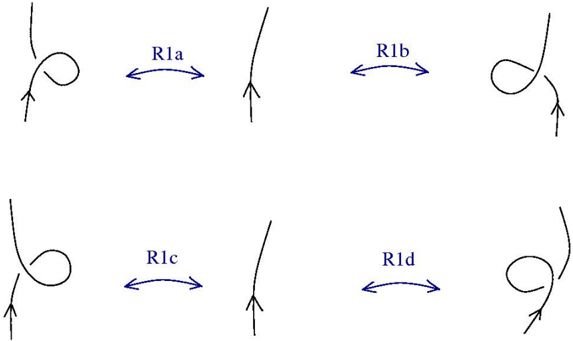
The image contains four diagrams arranged in a 2x2 grid, each illustrating a transformation process from a looped line to a straight line. Arrows indicate the direction of transformation, labeled as R1a, R1b, R1c, and R1d.
### Components/Axes
- **Diagrams**:
- **Top Row**:
- **Left (R1a)**: A looped line (leftward arrow) transforms into a straight line (downward arrow).
- **Right (R1b)**: A looped line (rightward arrow) transforms into a straight line (downward arrow).
- **Bottom Row**:
- **Left (R1c)**: A looped line (leftward arrow) transforms into a straight line (downward arrow).
- **Right (R1d)**: A looped line (rightward arrow) transforms into a straight line (downward arrow).
- **Labels**:
- R1a, R1b, R1c, R1d (blue text, centered between looped and straight lines).
- **Arrows**:
- Directional arrows (black) indicate transformation flow.
### Detailed Analysis
- **R1a**: Looped line (leftward) → Straight line (downward).
- **R1b**: Looped line (rightward) → Straight line (downward).
- **R1c**: Looped line (leftward) → Straight line (downward).
- **R1d**: Looped line (rightward) → Straight line (downward).
- **Spatial Grounding**:
- Labels (R1a-R1d) are centrally positioned between the looped and straight lines.
- Arrows are placed at the ends of the lines to denote direction.
### Key Observations
1. All transformations result in a straight line with a downward arrow, regardless of the initial looped line's direction.
2. The looped lines in R1a and R1c share identical directional arrows (leftward), while R1b and R1d share rightward arrows.
3. No numerical data, scales, or legends are present.
### Interpretation
The diagrams likely represent a conceptual or procedural flow, where each R1 label denotes a distinct transformation step or category. The consistent downward arrow in the final straight lines suggests a unified outcome or endpoint across all processes. The variation in initial looped line directions (left/right) may indicate different input conditions or scenarios leading to the same result. The absence of quantitative data implies this is a schematic representation rather than a statistical analysis.