## Pie Chart: Distribution of Components in a Technical System
### Overview
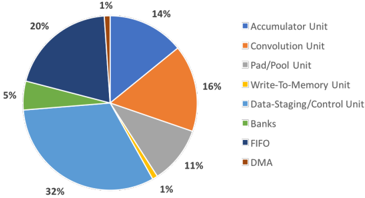
The pie chart illustrates the proportional distribution of various computational units and memory components within a technical system. The chart uses distinct colors to represent each component, with percentages indicating their relative contribution to the system's architecture.
### Components/Axes
- **Legend**: Positioned on the right side of the chart, mapping colors to components:
- **Accumulator Unit**: Dark blue
- **Convolution Unit**: Orange
- **Pad/Pool Unit**: Gray
- **Write-To-Memory Unit**: Yellow
- **Data-Staging/Control Unit**: Light blue
- **Banks**: Green
- **FIFO**: Dark blue
- **DMA**: Brown
- **Axes**: No explicit axes; the chart is circular, with percentages labeled directly on each segment.
### Detailed Analysis
1. **Data-Staging/Control Unit** (32%): Light blue, occupying the largest segment at the bottom of the chart.
2. **Accumulator Unit** (20%): Dark blue, adjacent to the largest segment.
3. **Convolution Unit** (16%): Orange, positioned clockwise from the Accumulator Unit.
4. **Pad/Pool Unit** (14%): Gray, following the Convolution Unit.
5. **Write-To-Memory Unit** (11%): Yellow, smaller segment near the center.
6. **Banks** (5%): Green, a small wedge near the top.
7. **FIFO** (1%): Dark blue, same color as the Accumulator Unit but significantly smaller.
8. **DMA** (1%): Brown, the smallest segment, adjacent to FIFO.
### Key Observations
- The **Data-Staging/Control Unit** dominates the system, comprising over one-third of the components.
- The **Accumulator Unit** and **Convolution Unit** are the next largest contributors, together accounting for 36%.
- The **Write-To-Memory Unit**, **Banks**, **FIFO**, and **DMA** occupy progressively smaller portions, with the latter two at 1% each.
- **Color Conflict**: Both the **Accumulator Unit** (20%) and **FIFO** (1%) are labeled as dark blue in the legend, despite differing significantly in size. This may cause visual ambiguity.
### Interpretation
The chart highlights a hierarchical resource allocation, with the **Data-Staging/Control Unit** as the central component, likely responsible for managing data flow and system coordination. The **Accumulator Unit** and **Convolution Unit** suggest a focus on arithmetic operations and signal processing, respectively. The near-identical color for **Accumulator Unit** and **FIFO** (both dark blue) risks misinterpretation, as their roles and sizes differ drastically. This could indicate a design oversight in the legend or chart labeling. The minimal allocation to **FIFO** and **DMA** (1% each) implies these components are peripheral or optimized for low-overhead functionality. Overall, the system prioritizes data management and computational units over memory and buffering elements.