## Histogram: Model Rating Distributions
### Overview
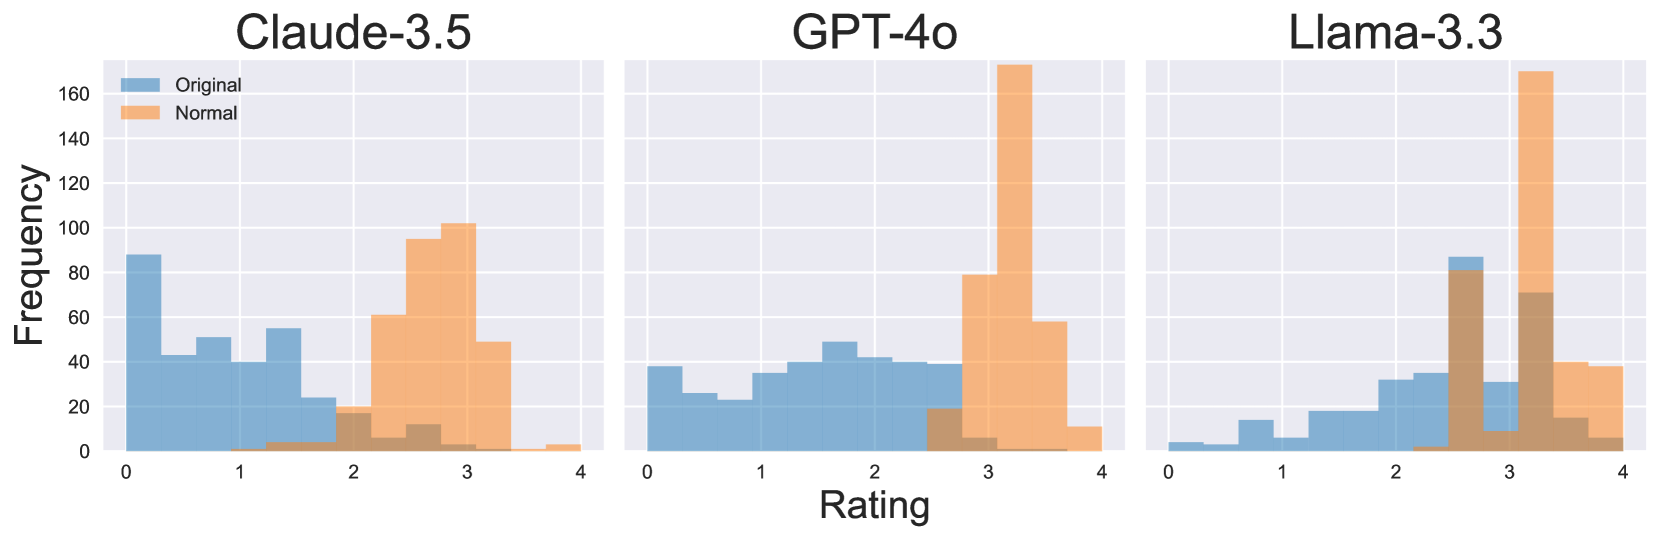
The image presents three histograms comparing the rating distributions of three language models: Claude-3.5, GPT-4o, and Llama-3.3. Each histogram displays the frequency of ratings for "Original" and "Normal" categories. The x-axis represents the rating, ranging from 0 to 4, and the y-axis represents the frequency, ranging from 0 to 160.
### Components/Axes
* **Titles (Top):** Claude-3.5, GPT-4o, Llama-3.3
* **X-Axis Title:** Rating
* **X-Axis Scale:** 0, 1, 2, 3, 4
* **Y-Axis Title:** Frequency
* **Y-Axis Scale:** 0, 20, 40, 60, 80, 100, 120, 140, 160
* **Legend (Top-Left):**
* Blue: Original
* Orange: Normal
### Detailed Analysis
**Claude-3.5:**
* **Original (Blue):** The distribution is relatively uniform between 0 and 2, with a peak around 0. The frequency is approximately:
* 0: 90
* 1: 50
* 2: 20
* 3: 0
* 4: 0
* **Normal (Orange):** The distribution is skewed towards higher ratings, with a peak around 3. The frequency is approximately:
* 0: 0
* 1: 0
* 2: 20
* 3: 100
* 4: 10
**GPT-4o:**
* **Original (Blue):** The distribution is relatively uniform between 0 and 3, with a peak around 2. The frequency is approximately:
* 0: 30
* 1: 40
* 2: 40
* 3: 40
* 4: 0
* **Normal (Orange):** The distribution is heavily skewed towards a rating of 3. The frequency is approximately:
* 0: 0
* 1: 0
* 2: 0
* 3: 170
* 4: 10
**Llama-3.3:**
* **Original (Blue):** The distribution is skewed towards higher ratings, with a peak around 3. The frequency is approximately:
* 0: 0
* 1: 0
* 2: 10
* 3: 90
* 4: 10
* **Normal (Orange):** The distribution is heavily skewed towards a rating of 4. The frequency is approximately:
* 0: 0
* 1: 0
* 2: 0
* 3: 70
* 4: 170
### Key Observations
* For Claude-3.5, the "Original" ratings are more evenly distributed, while "Normal" ratings are concentrated around 3.
* For GPT-4o, "Original" ratings are relatively uniform, while "Normal" ratings are overwhelmingly concentrated at 3.
* For Llama-3.3, "Original" ratings peak at 3, while "Normal" ratings are heavily concentrated at 4.
### Interpretation
The histograms suggest that the "Normal" ratings tend to be higher than the "Original" ratings across all three models. GPT-4o and Llama-3.3 show a particularly strong bias towards higher ratings in the "Normal" category, with most ratings clustered around 3 and 4, respectively. Claude-3.5 shows a more moderate shift towards higher ratings in the "Normal" category. This could indicate that the "Normal" condition leads to more favorable ratings compared to the "Original" condition for these language models.