## Line Graph: Performance Comparison of Learning-Agent vs Standard-Agent
### Overview
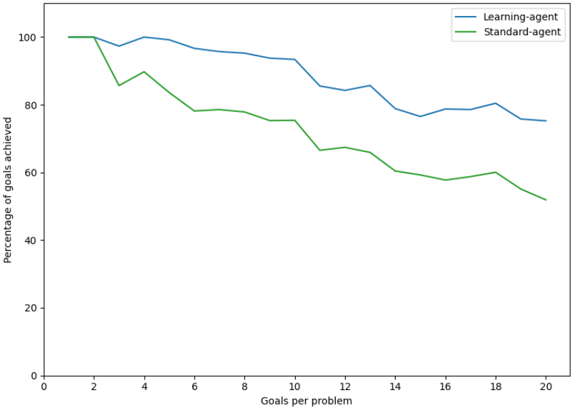
The image is a line graph comparing the performance of two agents ("Learning-agent" and "Standard-agent") across varying numbers of goals per problem. The y-axis represents the percentage of goals achieved, while the x-axis represents the number of goals per problem (ranging from 0 to 20). The graph shows distinct trends for both agents, with the learning-agent consistently outperforming the standard-agent as the complexity (goals per problem) increases.
### Components/Axes
- **X-axis**: "Goals per problem" (0 to 20, integer increments).
- **Y-axis**: "Percentage of goals achieved" (0 to 100, integer increments).
- **Legend**: Located in the top-right corner, with:
- **Blue line**: Learning-agent.
- **Green line**: Standard-agent.
### Detailed Analysis
1. **Learning-agent (Blue Line)**:
- Starts at **100%** when goals per problem = 0.
- Experiences a slight dip to ~95% at 2 goals per problem.
- Fluctuates between ~90% and ~98% for 3–10 goals per problem.
- Declines gradually to ~75% at 20 goals per problem.
- Shows minor volatility but maintains a relatively stable performance.
2. **Standard-agent (Green Line)**:
- Starts at **100%** when goals per problem = 0.
- Drops sharply to ~85% at 2 goals per problem.
- Declines steadily to ~65% at 10 goals per problem.
- Further decreases to ~50% at 20 goals per problem.
- Exhibits a consistent downward trend with no recovery.
### Key Observations
- The learning-agent maintains a **~15–20% higher performance** than the standard-agent across all goal complexities.
- The standard-agent’s performance degrades **nonlinearly**, with a steep drop after 2 goals per problem.
- The learning-agent’s performance stabilizes after an initial dip, suggesting adaptability to increased complexity.
### Interpretation
The data demonstrates that the learning-agent is more robust in handling problems with higher goal complexity compared to the standard-agent. The standard-agent’s performance deteriorates significantly as the number of goals per problem increases, indicating potential limitations in scalability or adaptability. The learning-agent’s ability to maintain higher performance suggests it may incorporate mechanisms (e.g., dynamic prioritization, reinforcement learning) to manage complex tasks effectively. The initial dip in the learning-agent’s performance at 2 goals per problem could reflect a transitional phase before optimization, but it recovers and sustains superiority. This trend highlights the importance of adaptive algorithms in multi-goal environments.