\n
## Heatmap: Layer-wise Activation/Attention Across Training Steps
### Overview
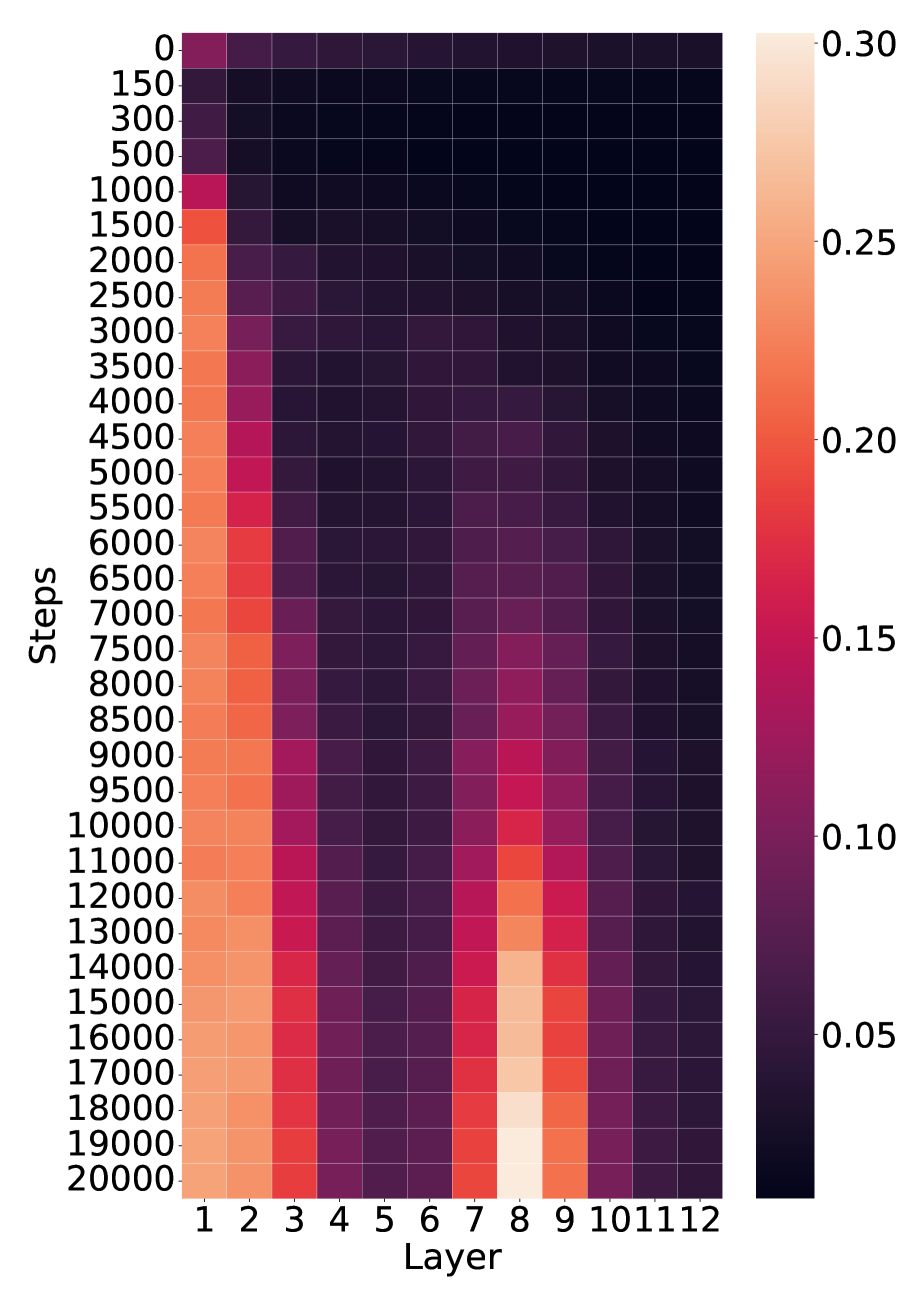
The image is a heatmap visualizing a numerical metric (likely activation magnitude, attention weight, or gradient norm) across two dimensions: **training steps** (vertical axis) and **network layers** (horizontal axis). The color intensity represents the value of the metric, with a scale provided on the right. The data suggests the evolution of layer-wise importance or activity during the training of a neural network.
### Components/Axes
* **Vertical Axis (Y-axis):** Labeled **"Steps"**. It represents training iterations, starting at **0** at the top and increasing downward to **20000** at the bottom. The tick marks are at intervals of 0, 150, 300, 500, 1000, 1500, 2000, 2500, 3000, 3500, 4000, 4500, 5000, 5500, 6000, 6500, 7000, 7500, 8000, 8500, 9000, 9500, 10000, 11000, 12000, 13000, 14000, 15000, 16000, 17000, 18000, 19000, 20000.
* **Horizontal Axis (X-axis):** Labeled **"Layer"**. It represents discrete layers of a model, numbered **1** through **12** from left to right.
* **Legend/Color Bar:** Positioned vertically on the **right side** of the heatmap. It maps color to numerical value.
* **Scale:** Linear, ranging from approximately **0.05** (dark purple/black) to **0.30** (light peach/cream).
* **Key Tick Values:** 0.05, 0.10, 0.15, 0.20, 0.25, 0.30.
* **Color Gradient:** Dark purple/black (low values) → Purple → Magenta → Red → Orange → Light peach (high values).
### Detailed Analysis
The heatmap reveals distinct patterns of activity across layers and training progression:
**1. Trend by Layer (Horizontal Bands):**
* **Layers 1-3 (Leftmost):** Show consistently **high values** (orange to light peach). The intensity increases noticeably with more training steps. Layer 1 is the brightest overall.
* **Layers 4-6 (Center-Left):** Exhibit **very low values** (dark purple/black) throughout training, forming a dark vertical band.
* **Layers 7-9 (Center-Right):** Display a **dynamic pattern**. Values are low initially but increase significantly after ~8000 steps, peaking around **Layer 8** at the highest steps (15000-20000), where it reaches the maximum scale value (~0.30). Layer 7 shows a strong increase, and Layer 9 shows a moderate increase.
* **Layers 10-12 (Rightmost):** Maintain **low to very low values** (dark purple), similar to Layers 4-6, with no significant increase over time.
**2. Trend by Steps (Vertical Progression):**
* **Early Training (0 - ~1000 steps):** All layers show relatively low values. The highest activity is in Layer 1, but it is still in the magenta range (~0.15).
* **Mid Training (~1000 - ~8000 steps):** Activity in **Layers 1-3** intensifies steadily to orange levels (~0.20-0.25). **Layers 4-6 and 10-12** remain dark. **Layers 7-9** begin to show a faint increase from purple to magenta.
* **Late Training (~8000 - 20000 steps):** This phase shows the most dramatic changes.
* **Layers 1-3** continue to brighten, with Layer 1 approaching the top of the scale (~0.28-0.30).
* **Layers 7-9** undergo a pronounced "awakening." Layer 8, in particular, transitions rapidly from magenta to bright orange and finally to the lightest peach color on the scale, indicating it becomes the most active layer by the end of training.
* The dark bands (Layers 4-6, 10-12) persist.
### Key Observations
* **Bimodal Activation Pattern:** The network develops two primary "hotspots" of activity: the **very early layers (1-3)** and a **specific middle layer (8)**, with Layer 7 and 9 as supporting actors.
* **Stable Low-Activity Zones:** Layers 4-6 and 10-12 remain consistently inactive throughout the observed training period.
* **Delayed Peak in Layer 8:** The most striking feature is the late and sharp rise in value for Layer 8, suggesting it plays a crucial role that only becomes prominent after substantial training.
* **Gradient of Intensity:** Within the active groups, there is a clear gradient. In the early group, Layer 1 > Layer 2 > Layer 3. In the middle group, Layer 8 > Layer 7 > Layer 9.
### Interpretation
This heatmap likely visualizes a metric like **attention head importance**, **activation norm**, or **gradient flow** in a 12-layer transformer or similar deep learning model during training.
* **What the data suggests:** The model learns to rely heavily on its **initial processing layers (1-3)** from the start, with their importance growing steadily. Concurrently, a **specialized function** appears to consolidate in **Layer 8**, but this function only becomes critical after the model has undergone significant training (post-8000 steps). This could correspond to the model learning higher-level, compositional features that depend on lower-level features being well-established.
* **Relationship between elements:** The early layers (1-3) likely perform fundamental feature extraction (e.g., basic syntax, local patterns). The dormant middle layers (4-6) might be involved in more complex but less "weighted" transformations. The late-blooming activity in Layer 8 (and neighbors 7,9) suggests it is a **key integrative or reasoning layer** where information from earlier layers is combined for final decision-making. The persistent inactivity of layers 10-12 is unusual and might indicate they are either redundant, under-utilized, or serve a very specific, infrequent function not captured by this metric.
* **Anomalies and Implications:** The sharp, late rise of Layer 8 is the most notable anomaly. It challenges the common intuition that deeper layers are always more important. Instead, it shows **functional specialization can emerge at a specific depth late in training**. This has implications for model pruning (avoiding cutting Layer 8) and interpretability (focusing analysis on the early layers and Layer 8). The clear separation between active and inactive layer groups suggests a modular architecture has emerged organically during training.